
- in Data , Research by Cesar Alvarez
To dividend adjust or not to dividend adjust? That is the question.
About once a month, someone asks how important it is to have dividend adjusted data. Or someone will comment they do not want to use Norgate Data because they do not adjust for dividends (it does but it is not enabled by default). My answer has been “without dividend adjusted data, your results may be understated.” It has always bothered me that I could not give a better answer. In my post, “How much does not having survivorship free data change test results?” I covered other data issues but not this one. Since Norgate Data makes it easy to have two databases, one with the dividend adjustments and one without, it was time to run tests and determine how much of a difference it makes.
What is dividend adjusted data?
On most platforms, stock data is not typically adjusted for regular dividends. The data is only adjusted for stock splits and special dividends. Yahoo’s charts are an example of this. When a stock issues a dividend, the price of the close on that day only is reduced by the dividend amount. For example, AT&T has a $.46 dividend per share and is trading around $34. If on the day dividend adjustment, had AT&T closed flat at $34 then the stock price would be adjusted to $33.56, looking like it closed down 1.3%. This apparent down close has repercussions on technical indicators by changing their values. Even something simple like how many down/up closes a stock has had or moving averages are changed by this.
Some data providers, Norgate Data being one, allow one to decide if the data is adjusted for dividends. In the AT&T example they adjust all previous Open, High, Low, Close values by 1.3%. How much does this change indicator values?
Strategy Tests
The tests are simple. Testing is done on three strategies. The first a breakout strategy with an average hold of 1-3 months. The second a S&P500 strategy with an average hold of 1 month. The third a mean reversion strategy with an average hold of 3 days. The tests are run on the dividend adjusted database and the non-adjusted database. Test dates are 1/1/2004 to 9/30/2014.
Breakout Strategy
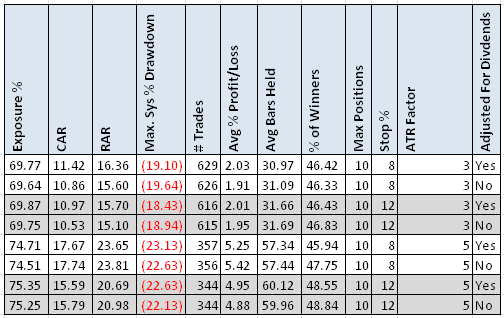
The surprises start right away. I expected the longer hold variations of the adjusted data to have slightly higher returns because there were more opportunities to be in a position when the dividend happened. But that is not the case. The statistics are all close to each other as I expected. Notice the slight differences in number of trades which is what gives the slight changes in the other statistics.
S&P 500 Strategy
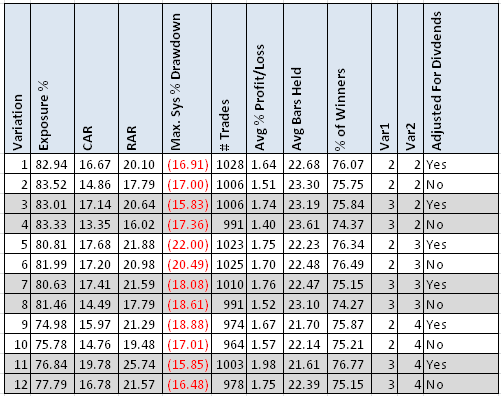
In this test, the CAR is always better with the dividend adjusted data while the MDD is mostly better. These are expected results since S&P500 stocks give more and larger dividends. Sometimes there are substantial differences.
Mean Reversion Strategy
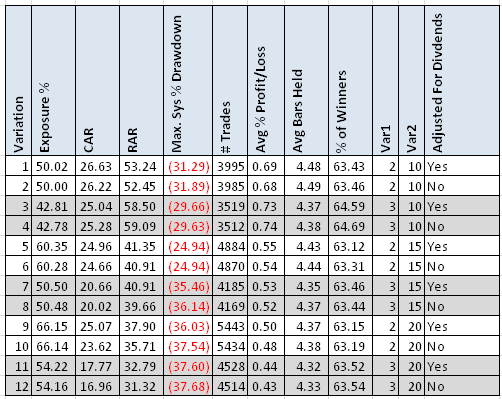
The mean reversion strategy trades smaller stocks which rarely have dividends. The CAR and MDD differences are in the realm of noise. Dividend adjusted data make no real difference in the results.
Technical Indicators
Next we will compare some technical indicator values. The comparison is to the nearest tenth. For example, if the RSI(2) is 89.2345 with dividend adjusted and 89.2357, we round to the nearest tenth and get 89.2 and 89.2, which we then say that the values are equal. My reasoning for comparing at this level is that one rarely cares to a greater precision. Now, there may be a huge difference between 4.99 and 5.01, if the buy rule is RSI(2) less than 5. For the comparison, I used IBM data from 1/1/2001 to 12/31/2013 which is 3269 data points.
Dividend Adjusted vs No Dividend Adjustment
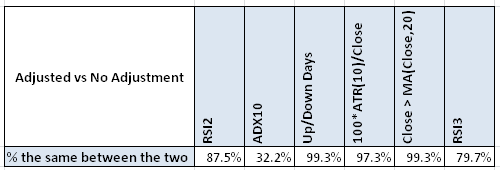
The ‘Up/Down Days,’ ‘ATR’ and ‘MA” indicators are exact most of the time. The RSI values have substantial difference while the ADX is wildly different.
Dividend Adjusted vs Dividend Adjusted – Two Different Snapshots
This test I have not seen elsewhere. Comparing two snapshots of a dividend adjusted data. What do I mean by this? I have Norgate Data installed on two computers. One was last updated on 7/16/2014 and the other on 10/17/2014. Would the adjustments have a noticeable effect in results? I expect it would not. I ran this only on the S&P500 strategy because if there would be a difference, here is where I would expect to see it.
S&P 500 Strategy
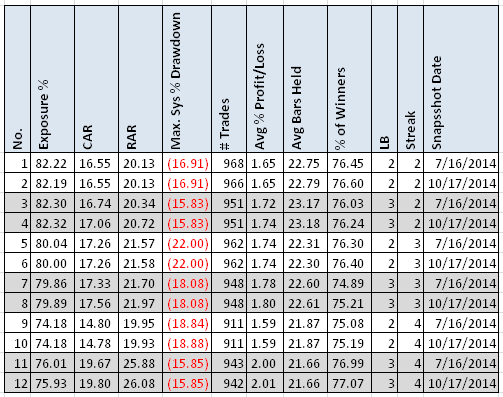
The results are nearly identical which is great to see.
Technical Indicators
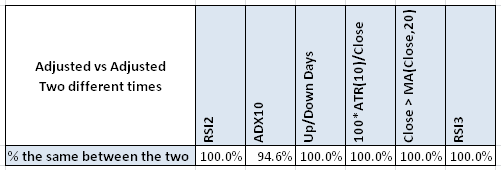
How would these indicators compare between the two snapshots since there was a dividend during this time period.
Only ADX(10) is not a perfect match.
Other Articles
Here are two more articles on this subject.
From EdgeRater, Dividends and Backtesting.
From StockChart.com, Historical Price Data is Adjusted for Splits, Dividends and Distributions.
Spreadsheet
If you’re interested in a spreadsheet of my testing results, enter your information below, and I will send you a link to the spreadsheet.
Final Thoughts
Will I still advocate using dividend adjusted data? Yes, but with an asterisk. If one is primarily testing on stocks that do not have dividends, one can get away without having the data. If you one is testing on S&P500 stocks, then it is much more important to have the dividend adjusted data. But even dividend adjusted data is not perfect. Run the same strategy today and again 6 months later and your results will not be exactly the same. They are likely to be very close but maybe that one trade difference is a huge winner or loser. Now your stats may change dramatically. As always, it is important to be aware of data issues.
Backtesting platform used: AmiBroker. Data provider:Norgate Data (referral link)
