
- in ETFs , Trend Following by Cesar Alvarez
Sector trading using the 200-day moving average
A user commented on ETF Sector Rotation post about a simple idea for trading the sector ETFs, which I can’t believe I have never tried. I like keeping things simple just like my Brazilian Jiu-Jitsu game.
Rules
If the Select Sector SPDR ETF (XLY, XLP, XLF, XLE, XLV, XLI, XLB, XLK, XLU) is above its 200-day moving average for the last 5 days, then buy 10% of that ETF. If it is below the 200-day moving average for the last 5 days, then sell it and allocate to IEF, iShares 7-10 Year Treasury Bond. Simple, I like it!
If all ETFs are above their MA200s, then you will be invested 10% in IEF. If two are below their MA200s, then you would be invested 30% in IEF.
This differs slightly from the original rules where he said to use the 40-week moving average, but I prefer the 200 and using 5 days above/below which makes it close to that. This is close to my current favorite method of trading the MA200, which uses 10 days and I will show.
A note about why I am not using XLRE. Since 1999 these sector ETFs only consisted of nine ETFs. In late 2015, they did a revamp and added XLRE. To test farther back, I tested without it.
Baseline
Test dates will be from 4/1/2009 to 6/30/2017 (bull market only) and 1/1/2007 to 6/30/2017 (bear and bull markets).
For strategies like this, they will probably underperform during bull markets, 2009 to 2017. But they make it up during bear markets. I will use two baseline strategies. The first is buy and hold of the SPY. The second is my new favorite way of trading the MA200. Buy the SPY when it is above the 200-day MA for 10 or more days. Sell the SPY when it is below the 200-day MA for 10 or more days. This new method has a lot less trades and whipsaws when compared to trading the 200-day MA cross.
Bull Market Results
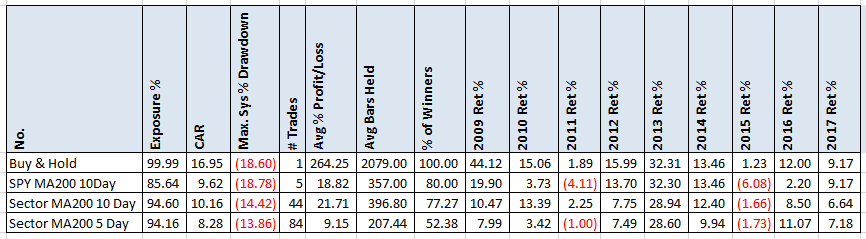
Buy and Hold greatly outperformed everything as expected. If you trade these type of strategies, you must remember that during this time you will likely underperform. But comparing this sector strategy to my SPY strategy baseline it compares well. With CARs about the same but with a lower drawdown.
Bull & Bear Market Results
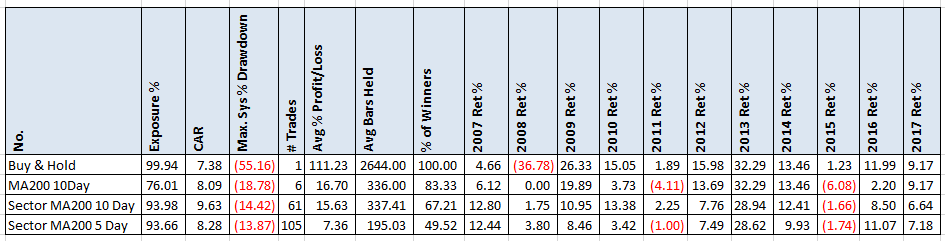
Now we can see why one would trade these types of strategies. Even though the CAR is only slightly better, the drawdowns are much smaller. But can you hold during bull markets and the underperformance then? I have a similar strategy I trade and I must remind myself during these last few years of underperformance that this is why I trade the strategy. For the bear market survival and my sanity.
Spreadsheet
Fill the form below to get the spreadsheet to see the results of using different moving average lengths, the number of days above/below and lots more stats.
One surprise from all this is that using the 200 day moving average gave the best results.
Final Thoughts
This simple idea gave some good results. The question to ask yourself is all the extra work involved in trading the Sector MA200 with 10 Day strategy that much better than the SPY MA200 with 10 Day baseline? The trade difference is 6 vs 61 over the 10.5 years. Probably not for me.
Another test to try out would be instead of allocating 10% to each ETF, doing 11%. This should give a bump in CAR. I would try and to incorporate XLRE also into the test. What about a different ETF instead of IEF. Good potential here.
See Part 2 here where I test reader’s ideas, Sector trading using the 200-day moving average – Part 2.
Another post in the series: ETF Sector Trading: The effect of daily, weekly and monthly timeframes.
Backtesting platform used: AmiBroker. Data provider: Norgate Data (referral link)
Good quant trading,

Fill in for free spreadsheet:

