September 6, 2017

Broken Strategy or Market Change: Investigating Underperformance

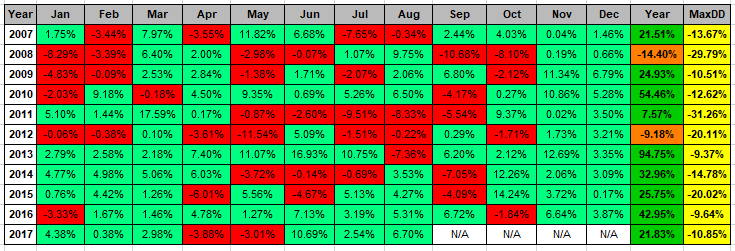
I recently had someone email me about the performance of a strategy I created back in late 2005/early 2006 and traded for a few years. I remember the strategy being a daily mean reversion set up with an intraday pullback entry. I figured it probably had not done well over the last decade. I stopped trading in the middle of 2008 because I did not like how it was behaving. In the backtest it did well in bear markets but was not doing so in the middle of 2008.

I ran the strategy from 2007, using the rules as they were published and was pleasantly surprised by the results. A CAR of 25%. Overall not too bad. Wish I had still been trading it. This is an eleven year out of sample test.

Then I remembered, didn’t this have insane results from 2000 to 2005. Here are those results.

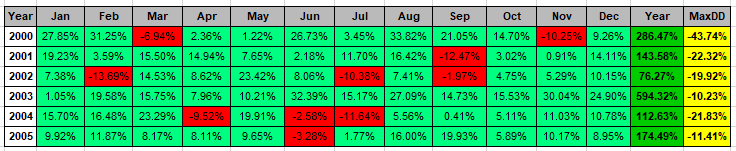
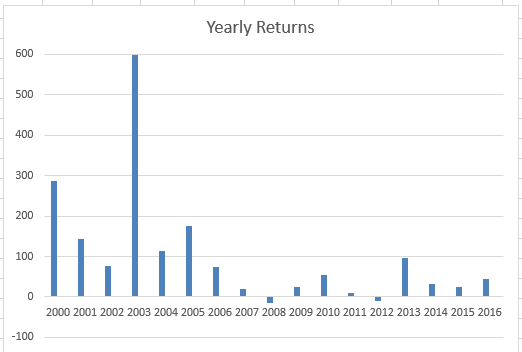
Did you notice that 595% return in 2003? Now I am thinking what the heck happened since 2007? Look at the drop in yearly returns. Was the original strategy overfit and flawed? Did the markets change? If so, what is the difference? What follows is my investigation into trying to determine if the strategy is broken or the markets have changed.


Rules

I cannot share the rules because of the NDA I signed when it was created. What I can say is that it is a very typical mean reversion strategy that trades stocks.

I will include 2006 in the In-sample period because the return for the year was in line with previous years

Curve Fit?

Was the initial strategy curve fit? I do not have the original code so I made a best guess of the parameters I would have optimized on and their values. The strategy CAR was 1.3 standard deviations from the average of all the variations. Even the worst variation still had a very good CAR from 2000 to 2005 and saw similar drop in performance. This variation may have been a little overfit but that is not the entire story.

Number of Trades

Is there a decline in the number of trades? Average number of trades per year.

  • 2000 to 2006: 171
  • 2007 to 2016: 88

Wow, a drop of 50%! That starts to explain a lot. But why less trades?

Trading Universe

Are fewer stocks passing our liquidity filter? This the average per year.

  • 2000 to 2006: 978,239
  • 2007 to 2016: 861,763

A small decline but it does not explain the large drop.

Number of Setups

Since the strategy depends on intraday sell off, maybe we are seeing less setups. This is the average per year.

  • 2000 to 2006: 5307
  • 2007 to 2016: 2537

That explains the lower number of trades per year. We have less setups. This means we are seeing fewer stocks sell off and setting up for a mean reversion trade. This explains a lot. But let us see if it is the entire story.

Avg % P/L per Trade

Is the quality of the trade dropping too? Meaning what is the average % profit/loss per trade?

  • 2000 to 2006: 6.25%
  • 2007 to 2016: 2.73%

Anther drop of 50%. A double whammy. These last two stats explain the drop in the performance. But I wanted to know more.

Volatility

Are the trades less volatile and is that why they are not as big? These are the average 100-day historical volatility of the trades.

  • 2000 to 2006: 116%
  • 2007 to 2016: 106%

That is not leading to the decrease. What is causing the decrease in average % p/l? I don’t know what else to look at.

Final Thoughts

Is this strategy broken? I don’t think so. But what has changed is the market, which has greatly reduced the returns. Having fewer setups and smaller gains on the trades seems to have caused the reduction in returns. As to why, my theory is that it’s because of the popularity of mean reversion strategies and quantified trading. Have any ideas on what is going on or other tests you want to see? Post them in the comments below.

Remember we had 11 years of out-of-sample data to work with to determine if the strategy was originally overfit or if it had broken or if the markets had changed. Even with all this data it was not completely easy to figure out what was going on. The next time your strategy starts to perform poorly after 3 to 12 months, remember how hard it can be. I dropped the strategy after 6 months. It was not broken, the markets had changed.

Backtesting platform used: AmiBroker. Data provider: Norgate Data (referral link)

Good quant trading,

Click Here to Leave a Comment Below

Mark - September 6, 2017 Reply

I read an interesting article on mean reversion. One of the first points made was most short term oriented hedge funds use mean reversion. It seems like that diminishes the opportunities for mean reversion in larger, more liquid names. https://www.quantopian.com/posts/enhancing-short-term-mean-reversion-strategies-1

I would be curious to see how well the strategies Toby Crabel developed in the 1980s have held up. It seems your former employer borrowed and expanded on numerous of those ideas. For example, the idea that volatility is mean reverting. So if you have a wide range day (WR7) then a gap the next day, that gap should be faded. In Crabel’s original work that had a very high winrate (85%).

Thomas E. Musselman - September 6, 2017 Reply

Are these type of tested results one of the following:
a) you start with $ X, say $100,000, so you can’t invest in every setup if your money is still in a prior one.
b) you divide your funds equally if more than one setup occurs at once
c) you include a sample transaction cost.
Just trying to make sense of real-world results; trading something only held weekly generates considerable transaction cost drag, especially spreads. How large a market cap does this strategy grab? If you are losing 1% plus/trade to transaction costs….

    Cesar Alvarez - September 6, 2017 Reply

    For (a,b,c) yes that is correct
    These are not “real” trading results. But from a backtest from a strategy a created in 2005/2006 and basically have not looked at since mid-2008.

Helena - September 7, 2017 Reply

It’s not just mean reverts that are affected. I’ve been trading various systems of various time frames since 2006. These systems are holding up very well BUT the returns are getting lower and lower each year. My initial guess is that trading ranges are getting tighter with more people on the bandwagon getting in and out at similar prices. Spreads are not as big as they used to be on a % basis – just have a look at charts from 1990s. I’ve just randomly picked AAPL and looked for average size candles. H to L: 1992 4.8%, 2002 = 6.02%, 2006 = 5.18, 2012 = 2.45%, 2017 = 2.1%. It could also be a sign of a maturing market? Be interesting to compare to DAX or FTSE. Guess what it really means for independent traders is we need a whole lot more different ‘types’ of systems to make a living.

    Cesar Alvarez - September 7, 2017 Reply

    Part of it is probably due to a mature market overall. I am not sure more systems is really the solution since they all smaller returns. I trade multiple different strategies and have seen all the returns decrease over the last decade.

Helena - September 8, 2017 Reply

Yes the decrease in returns is very noticeable across the board and yet the % returns haven’t varied that much – merely the $ suffered. Maybe we can blame the ETFs and algo trading? Sounds good to me! But still be good to check more markets and maybe run a Cum ROC and H-L scenario on all the majors. Think I shall take on that task and report back tomorrow – should be an interesting exercise on a year by year basis. Who knows? Maybe we should be trading other markets for shorter term returns and leaving the longer time frames for our own markets? Think it’s called “Globalisation” (UK spelling). Worst part about this exercise is it won’t show individual stock’s performance, but at least, hopefully, give us a glimmer of clue.

Tj - October 21, 2017 Reply

Thanks Cesar, can you elaborate on what drives the large average p/l %? Is it hold time ?

    Cesar Alvarez - October 22, 2017 Reply

    It is partially driven by hold time but the main driver is volatility of the stock.

Daniel Rericha - June 29, 2018 Reply

It hurts me to say it but, I believe these inefficiencies started to decrease as more people traded these setups.

    Cesar Alvarez - June 29, 2018 Reply

    I too believe edges have gotten smaller because more people trade these.

Bing - April 21, 2021 Reply

I think what Helena alluded to above may hold water, the %Barsize from H to L. Assuming that the Close percentile distribution remain unchanged (within the bar – although you should probably check if that is the case) then on average, the larger the barsize, the more likely the setups will trigger by registering more extreme values.

Similarly, for each setup with a deep limit order attached, the larger the barsize, the more likely a trade is triggered

Leave a Reply: