
- in Mean Reversion , Research , Stocks by Cesar Alvarez
ConnorsRSI Analysis
A couple posts ago, I did the RSI Analysis. This post will focus on ConnorsRSI which I created while working for Larry Connors. When creating the indicator, the focus was on short-term mean-reversion results. We will look at that here but also how does it handle longer-term holds. Since I did not test this when I originally did the work, I was looking forward to seeing the results.
ConnorsRSI
ConnorsRSI is an indicator made up of three components. The first being a 3 period RSI on the closes. The second being a 2 period RSI applied to the current up/down streak. The last being a rank of how big today’s move is. Then a simple weighted aveage is used to combine them. For more details on the calculation and how to use it see this link.
Rules
Test period is from 1/1/2006 to 12/31/2015. Rules in parenthesis are tested individually. There is no commission or slippage.
ConnorsRSI Rule
The ConnorsRSI rule is true on a cross of the value. If the ConnorsRSI rule is ‘CRSI(3-2-100)<5 ’ then this is true only on the day the ConnorsRSI(3,2,100) crosses from above 5 to below 5. These are the ConnorsRSI rules tested:
- CRSI(3-2-100)<5
- CRSI(3-2-100)>95
- CRSI(6-4-200)<15
- CRSI(6-4-200)>85
- CRSI(12-8-300)<22
- CRSI(12-8-300)>78
- CRSI(24-16-300)<27
- CRSI(24-16-300)>73
Parameters
Starting from the normal ConnorsRSI parameters of (2,3,100), I simply doubled them to get the next set to test. I did stop the last parameter at 300 because 400 and 800 seemed too large. As to how I choose, the cut-off value, I picked a value that gave about 5,000 trades when not using the MA200 filters.
Buy
- Stock is member of the S&P 500 index
- Stock Close is above $5
- The 21 day moving average of Close time Volume is greater than $1 million
- MA200 rule: (Close above MA200, Close below MA200, not used)
- SPX MA200 rule: (SPX close above MA200, SPX close below MA200, not used)
- ConnorsRSI rule is true
- Enter the next day at the open
Sell
- Exit (5, 10, 21, 63, 126) days later on the open
Multiple Entries
This is important. We allow multiple entries in a stock if the Buy rule happens again. For example, the Buy rule is ‘CRSI(3-2-100)<5 and the exit rule is 126 days. If the stock’s CRSI(3-2-100) crosses under 5 today, we enter. Now if it crosses again below 5 a month later we enter again. Each position is exited 126 day after entry and counted a separate trade.
The Baseline
All values in the tables that follow are for closed trades only. The baseline results in the tables below use the same rules as above but remove the ConnorsRSI rule. This allows us to compare how the ConnorsRSI rule changes the results.
P-value
We will be comparing the ‘average % profit/loss’ of the test vs the ‘average % profit/loss’ on the baseline, which is the population of all possible trades. To narrow down the results, I calculated the p-value for each test. Some may argue if this is the right metric or have other issues. I am trying to use this help point me to interesting results. I am not saying that a p-value below 5% (or 1% or whatever value you prefer) means that the results are good. Do I want a lower value, yes, but I do not have a hard cut off. They are shades for grey.
% Profit/Loss Results
Now given what I just said, I will use a cutoff of 5% for the p-value to narrow down results to show. There are 360 variations and 241 of those have p-values under 5%.
ConnorsRSI(3,2,100) & 5 Day Hold
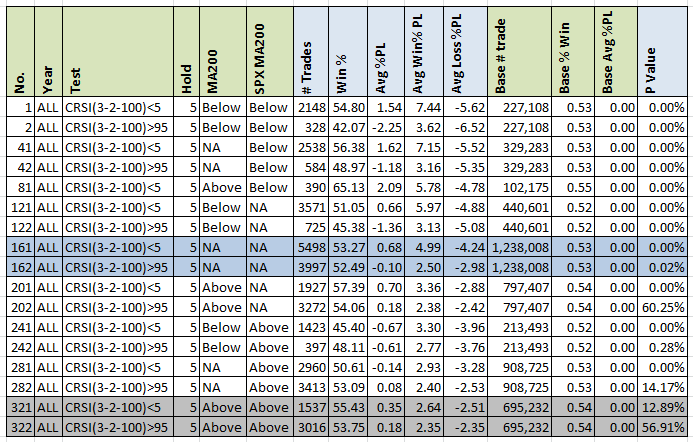
First I wanted to see the results for ConnorsRSI(3,2,100 at a 5 day hold. We notice that most look good and as expected. The two middle blue highlighted rows are the ones with no MA200 filter. These two have very low p-values. What is interesting to see is the two bottom grey rows. These are when the stock and index are both above the MA200. In this case we really have no edge. This is why it is important to test against various filters to understand what kind of market conditions your edge work best. As to why it is nor working under these conditions? I looked at the yearly returns for ConnorsRSI(3,2,100) and the last two years average % P/L have been -.04% and 0.00% for 2014 and 2015. Has ConnorsRSI stopped working? Maybe but we just don’t know.
63 Day Hold
How well does ConnorsRSI predict longer holding periods?
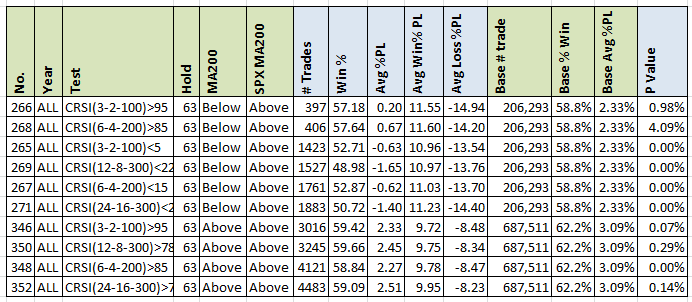
I filtered the results down to the using the stock’s MA200, the SPX above its MA200 and a P-value less than 5%. As to pointing to stock to trade with this longer hold, ConnorsRSI does not seem to help much. But what it could be used for is an exit on a longer holding strategy. Look at the top three rows. In all cases the return is much less than the base over the next 63 days.
ATR Multiple Results
I computed the average return over N days as a factor the 10 day ATR on the signal day. Sometimes this gave very different results than using ‘average % profit/loss.’ It is up to you to decide which one you want to focus on.
ConnorsRSI(3,2,100) & 5 Day Hold
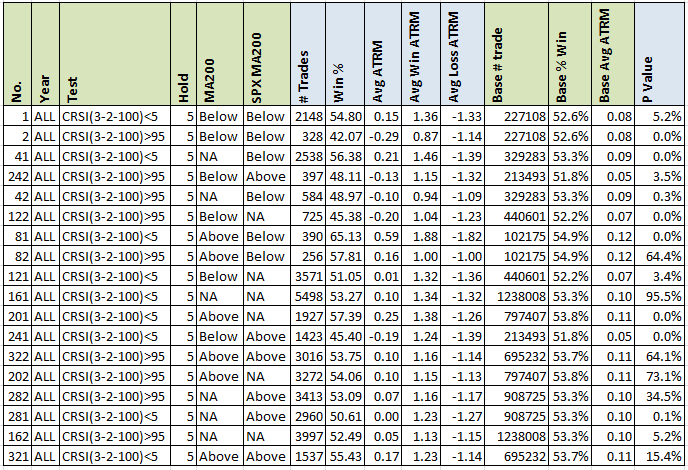
A couple more of the variations do not have p-values under 5%. But the same general pattern as using ‘avg %p/l’ holds in this case too
Spreadsheet
Fill the form below to get the spreadsheet with lots of more information. See data on the other holds and other RSI values. Lots of great information here.
Final Thoughts
Like the RSI analysis, this showed it is important to decide what your metric is going to be. The same variation can give very different p-values depending on whether one was using ‘avg % p/l’ or ‘atr-multiple.’
Backtesting platform used: AmiBroker. Data provider:Norgate Data (referral link)
Good Quant Trading,

Fill in for free spreadsheet:

