
- in General by Cesar Alvarez
Dealing with Broken Arrows
When I buy a stock, I know the edge is for the stock to go up. I know that does not mean every stock is a guaranteed winner. Or that my losses will be small. But every now and then you get what I call a broken arrow. I was in Expedia (EXPE) as it triggered in my SP500 rotation system. It was in a nice up trend, everything looking great.
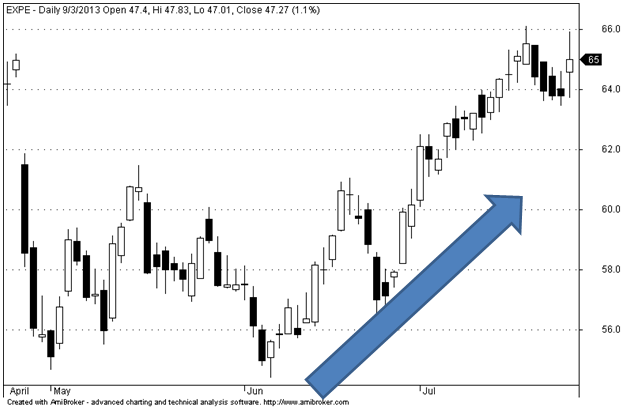
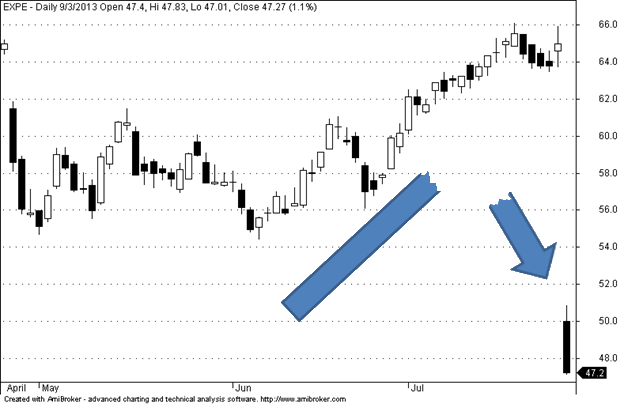
And then …earnings happened.
EXPE closed down that day 27%…ouch. That is what I call a Broken Arrow.
Make sure you have a plan before you enter any trade, and stick to it
If a Broken Arrow happens to you, do you know your exit strategy? I can tell you that if you hold trades overnight, a Broken Arrow will eventually happen. When a trade goes Broken Arrow, as it did with EXPE, the first thing I do is go with my plan. Not a plan that I invent after it happens, the plan I created before I entered the trade. In this particular case, my plan was to simply hold until the next 5 day rotation period (I was trading this in a rotation system).
Then I starting thinking is this the best thing to do in this case? From previous research, I know that large drops are usually the worst time to sell. Maybe holding for five days is not best. Maybe it is best to sell at the open on the next day. Or wait for the RSI2 to be greater than 70.
A rule I have is that I do not change a plan in mid-trade even if the research backs it up. One is still trading with too much emotion at that point to read the trade statistics dispassionately. But I wanted to know if the next time this happens (and there will be a next time), what my plan would be. Would it be the same or would I have a better exit?
Testing from 2009
Test results for my strategy start from 2009. I do not like testing too far back because markets change. We have been a bull market since 2009 and still are in it, so I believe the results are good.
S&P 500 Test Rules
I wanted to test that the stock was in a healthy uptrend which the moving averages do.
The Setup
- Stock is in the S&P 500
- Close > 40 day Moving Average of Closes
- Today’s 40 day Moving Average of Closes is greater than yesterday’s 40 day Moving Average of Closes
The Buy
- Yesterday was a Setup
- Today closes down 25%
S&P 500 stocks don’t have large one day losses that often
First I looked to see how many S&P 500 stocks closed down 1 day 25% or more. But only 8 did. I like to see at least 100 trades but prefer at least 200. Next I tried down 20% or more and this only gave 34 trades. Trying losses of 15% or more gave 121 trades. Enough in a pinch but I really wanted more. So I devise a way to take a look at a bigger universe of stocks.
The New Universe
To expand the universe, I went to the top 1000 stocks by dollar volume. A lot of these will be S&P 500 stocks and big cap stocks. I looked for stocks closing down 15% and this gave 318 trades which is enough for me.
The Tested Exits
I wanted to test three exits.
- Exiting the next day on the open
- Exiting on the next open when the RSI(2) closes above 70
- Exiting five days later on the open
Results
Included are the results for the S&P 500 for two reasons. One, to see if they produced similar results to the top 1000 stocks. Two, more data is always more interesting.
| Exit # | Exit Type | Universe | # of trades | Avg. Profit/Loss % | % Winners |
| 1 | Next Day Open | Top 1000 | 412 | 0.77% | 56% |
| 2 | RSI(2) > 70 | Top 1000 | 412 | 1.29% | 53% |
| 3 | Five Days | Top 1000 | 412 | 1.36% | 49% |
| 1 | Next Day Open | S&P 500 | 121 | 0.66% | 60% |
| 2 | RSI(2) > 70 | S&P 500 | 121 | 4.27% | 57% |
| 3 | Five Days | S&P 500 | 121 | 2.66% | 52% |
As you can see, waiting to get out at the next open on average produces a positive exit versus exiting on the close of the big down day. As painful as it is to see these big down days, it is best, on average, to at least wait until the next day to get out.
From previous research experience, I expected exiting with RSI(2) > 70 to produce the best results. Looking at the Top 1000 stocks, the results between exiting when RSI(2) > 70 or exiting five days later give about the same results. But more importantly, almost 2x better results than exiting the next day’s open. Looking at the S&P 500 results paints an even better picture. By the way, it is not trivial that the average hold for the 5 day exit is 5 days versus 10 trading days for the RSI(2) > 70 exit. Waiting for the bounce gives a much better average % profit/loss and % winners.
It looks like I will be changing my trading plan on these broken arrows. Fortunately they do not happen often.
Comments, suggestions or ideas on further tests? Put them in the comments window below!
Backtesting platform used: AmiBroker. Data provider:Norgate Data (referral link)
