
- in ETFs , Trend Following by Cesar Alvarez
ETF Sector Trading: The effect of daily, weekly and monthly timeframes
I recently gave a presentation on Sector trading using the 200-day moving average at the Northwest Traders and Technical Analysts. Some questions asked were:
- What if we only trade this monthly?
- What if we used weekly bars to trade only weekly?
- What if we used weekly bars to trade monthly?
The reason for these questions was to reduce the frequency of having to check signals and the total number of trades. My first response was that the results would probably be a little lower and the trade count also would be lower. But that was just a guess. I have been doing this long enough to know that I wrong 40% of the time. Curiosity got the better of me and I tested it out.
Original Rules
If the Select Sector SPDR ETF (XLY, XLP, XLF, XLE, XLV, XLI, XLB, XLK, XLU) is above its 200-day moving average for the last 10 days, then buy 10% of that ETF. If it is below the 200-day moving average for the last 10 days, then sell it and allocate to IEF, iShares 7-10 Year Treasury Bond. Entry and exit is on the next open.
If all ETFs are above their MA200s, then you will be invested 10% in IEF. If two are below their MA200s, then you would be invested 30% in IEF.
Variations Tested
These are all the reasonable combinations I could think of to test. Signal day is the day the signal is generated to enter or exit. Which means we enter/exit on the next open.
Daily timeframe
Using daily bars, we have these three tests.
- Allow any day to be a signal day
- Only the last day of the week can be a signal day
- Only the last day of the month can be a signal day
Weekly Timeframe
Since data is in the weekly timeframe, I reduce moving average to 40 weekly bars, which is about 200 daily bars. The close now must be two bars above the moving average for entry and two below for exit. We have these tests
- Signal day is the last day of the week
- Signal day is the last day of the week which is also the first one of the month
Monthly Timeframe
Since data is in the monthly timeframe, I reduce moving average to 10 monthly bars, which is about 200 daily bars. The close now must be one bar above the moving average for entry and one below for exit. We have this test.
- Signal day is the last day of the month.
Results
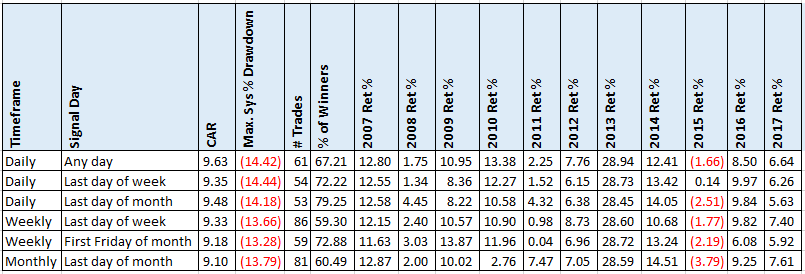
I was half right. The CAR dropped slightly but the trade counts in same cases went up. I was very surprised to see how much the number of trades jumped for the monthly timeframe. Even though it would require less time for a trader to check monthly, they would have 33% more trades. If one was looking for less trades, the right variation is using daily timeframe and checking once a month. The results are about the same with 13% fewer trades.
Spreadsheet
Fill the form below to get the spreadsheet to see the results and a lot more stats (top drawdowns, draw lengths, Sharpe Ratio, etc)
Final Thoughts
This is why I like doing research. What I think the results will be are frequently not what they are.
Backtesting platform used: AmiBroker. Data provider:Norgate Data (referral link)
Good quant trading,

Fill in for free spreadsheet:

