
- in Mean Reversion , Stocks by Cesar Alvarez
Hi-Lo Index as a Market Timing Indicator
My strategies use a market timing indicator to tell me when I should not be trading the strategy. The blog post, Avoiding Stock Market Crashes with the Hi-Lo Index of the S&P500, presented a very simple idea of using new highs vs new lows. The post tests trading the SPY & IEF but I wanted to know how well would it work on a S&P500 mean reversion strategy.
The Indicator
The Hi-Lo Index is calculated as the ratio of the number of S&P500 stocks that have reached new 3-month-highs minus those that have reached new 3-month-lows, divided by the number of stocks in the index. The article divided by 500 but the number of stocks in the index can vary around this number and since I have data to calculate the actual number, that is what I used. Then we apply a 40 day Moving Average to the indicator.
The market is good when the MA40 of Hi-Lo Index becomes greater than 5%. When it is below 5%, we will avoid taking new positions.
As a comparison, I will be testing using a simple Moving Average on the SPX as a market timing indicator.
Baseline Rules
Date range: 1/1/2005 to 9/30/2015
Setup
- Stock is member of S&P500
- Price is greater than $1
- The 21 day moving average of Dollar Volume is greater than $10 million
- The close is above the 200 day moving average
- The close is in the bottom 20% of the daily range
- The 2 period RSI is less than 20
Buy
- Rank stocks from high to low using 100 day Historical Volatility
- Place orders for the top ranked stocks so if they all get filled will be 100% invested. This means orders will often not get filled although lower ranked stocks may have
- Set a limit buy order for the next day if price falls another .25 times 10-day average true range.
Exit
- 2 period RSI greater than 80
- Exit on open next day
Misc.
- Maximum of 10 positions
- 10% allocation per position
- No margin is used
Baseline Results
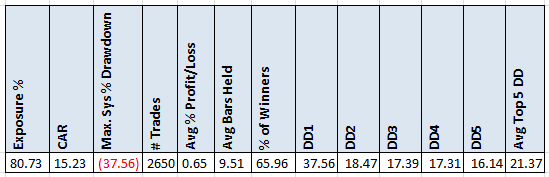
The focus will be on CAR, Maximum Drawdown and the average of the 5 worst drawdowns.
Moving Average on SPX
A very common market timing method is applying a moving average to the SPX. My favorite being the 200 day and another popular length being the 100 day. The available spreadsheet has results for more moving average lengths.
The new additional setup rule is:
- Close of SPX is greater than the 200 day of the moving average of SPX closes.
Moving Average Results
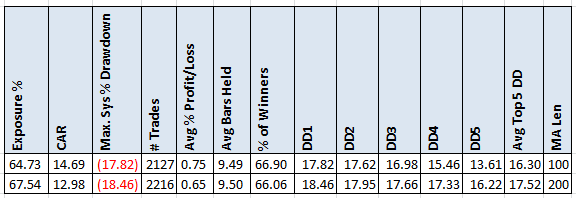
We can see the benefits and cons of adding a market timing filter. We had a drastic reduction in MDD and the average of the top 5 drawdowns. It came with a cost of reducing the CAR by 4% to 15%. In my book, this is a worthwhile tradeoff. Now the question is how does the Hi-Lo Index method compare?
Hi-Lo Index
The original rules used 5% as a cutoff and a 40 day moving average, which is highlighted below. I also tested different values with a small subset below and more values in the spreadsheet.
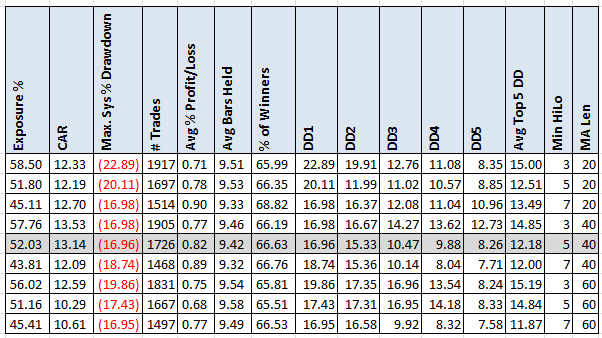
The CAR the Hi-Lo Index method is in the same range as using the moving average. The maximum drawdown is a little better. But two things caught my eye. The average % profit/loss took a big jump up. The best part, the average of the 5 worst drawdowns, dropped dramatically. From 16.30 to 12.20, or about 25%. WOW!
The suggested values from the original blog post, 5/40, also produced some of the best results here.
Spreadsheet
Fill the form below to get the spreadsheet with lots of more information. It contains the data for the HI-LO index so you can try it out yourself. It also includes yearly breakdown, other statistics and more variations.
Final Thoughts
This indicator has huge potential. I will have to apply it some of my current strategies to see how it works on them. I have current consulting client I must suggest that he try this on. The indicator is not easy to compute but it may be worth the effort. I suggest you try it on your short-term strategies.
Backtesting platform used: AmiBroker. Data provider:Norgate Data (referral link)
Good Quant Trading,

Fill in for free spreadsheet:

