
- in Research by Cesar Alvarez
Out-of-sample testing and luck
Continuing from the last post, I will show how using different definitions of passing our out-of-sample test can change our results. How luck can play a role if you use only one strategy to test out-of-sample. How you split your in-sample(IS) and out-of-sample(OOS) can change results.
The Strategy
I will be using a stock mean reversion strategy with an average hold of three days. Some of my comments may not apply in different situations.
Any mention of ConnorsRSI is using the default parameters of (3, 2, 100). The parameters tested below will give 1000 variations.
Set up Rules
- Stock is member of the S&P 500 index
- It has been less than (10,15,20,25,30) days since a 39 week high
- ConnorsRSI is less than (10 to 40 in steps of 2.5)
Entry Rules
- If we have a set up, then enter a limit order for the next day at (.5, 1.0, 1.5, 2.0)% below the close. Order good for one day only.
- Only place enough orders so if they are all filled you are not in more than 7 positions
- If have multiple set ups, then rank from high to low by the 100 day historical volatility.
Exit Rules
- ConnorsRSI is greater than (50, 55, 65, 70)
- Exit on next open
Success Metrics
How will we define success in our OOS test? Here is my list. Of course, yours would be different.
For a single variation
- CAR is more than twice the CAR of buying SPY when above MA200 and selling when below it. This is my can I beat a simple trading strategy success rule. It makes no sense to go to lots of work unless I can beat this.
- The ranking in OOS is in the top 20% of the 1000 variations
For the top decile
- The average CAR of the top decile is more than twice the CAR of buying SPY when above MA200 and selling when below it.
- Over 40% chance that a top decile variation is in the top 20% in OOS. Why 40%? If my strategy was completely random, then I would expect about a 20% chance of being in top 20%. I want to be substantially above this.
- Less than 10% chance that a top decile variation is in the bottom 20% in OOS. Why 10%? Again random would say a 20% of being in the bottom two deciles. I want this to be very unlikely.
- The chart of the top 100 in IS and what decile they end up in OOS looks “good”
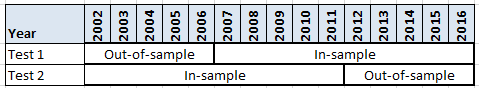
OOS period – Test 1
The IS dates will be from 1/1/2007 to 12/31/2016, which gives us 10 years of data and bull/bear market cycle. For the OOS sample period, I will use the previous 5 years from 1/1/2002 to 12/31/2006. This captures part of a bear and bull market.
From the 1,000 IS runs, we sort by CAR. Each person would need to pick their favorite metric, like Sharpe Ratio or CAR/MDD. I picked CAR because it is what I care about most. I take the 1,000 runs and group them into 10 equal sized buckets of 100 runs each. This gives me the decile in which each run falls in during the IS period.
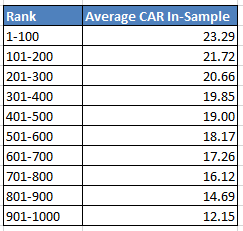
We can see our range of average CAR for each decile. The common method is to choose a single run and then see how it does in the OOS data. Let us do what I always say not to do and pick the #1 ranked variation. What rank does it have in the OOS data? 925. Yes that is correct, it went from the best ranked in IS to almost the worst ranked OOS. Those top ranked runs typically are there because they got lucky picking a few good trades or missing a few bad ones. Simply looking at the new OOS rank, you would conclude that the strategy failed the OOS test.
I know what you are thinking. I would never pick anything near the top. Great! How about the middle one, #50? That did much better in the OOS with a rank of 138.
First let us evaluate for single variation. Of the 100 in the top decile how many passed our metric?
99% of the variations passed this metric “CAR is more than twice of buying SPY when above MA200 and selling when below it.” If one used this method, no matter what variation they picked they are likely to conclude that their variation passed OOS.
While 38% of the variations passed this metric “the ranking in OOS is in the top 20% of the 1000 variations.” One had over a 60% chance of picking a variation that did not pass this metric. As we can see what we choose for a metric can have a huge influence on how likely our variation will succeed. Had this been our only metric, we are likely to conclude that our variation did not pass OOS.
A better question is how each decile did in the OOS data. If I take the top 100 variations in the IS data, what is their average rank and average CAR in the OOS data.
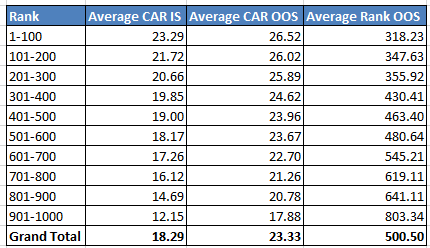
My first reaction to this was a sad reminder on how much better mean reversion was in the past. It is very rare for your OOS returns to be better.
The top decile had an average OOS CAR of 26.52 which 3.4 times better than my simple MA200 strategy on the SPY. For “over 40% chance that a top decile variation is in the top 20% in OOS” metric we get a 38% chance. Just short of passing. For “less than 10% chance that a top decile variation is in the bottom 20% in OOS” metric the value is 4%, easily passing.
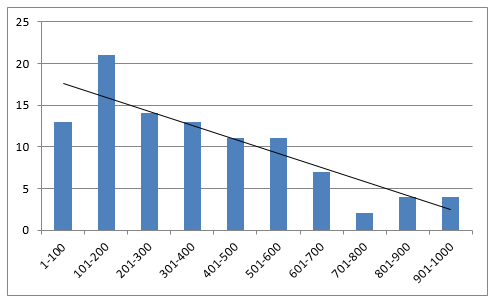
Out last metric, “the chart of the top 100 in IS and what decile they end up in OOS looks good.” This is a chart of the count of each decile that our top 100 in IS ended up in OOS.
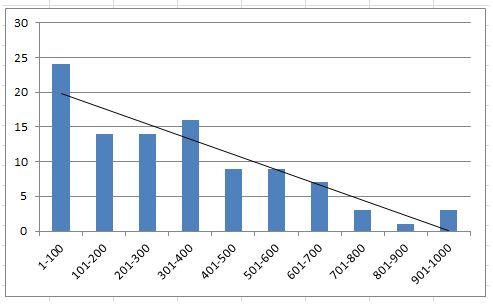
We want to see higher bars on the left with them shrinking as we go right. This is a great looking chart and the linear regression line even ends at zero on the worst decile.
Given these four metrics, I would say that my strategy concept passed the OOS testing. I like this method because it does not rely on luck of me choosing the right or wrong strategy to decide if I pass OOS. Unfortunately there is still going to be luck involved because most people can only trade one variation.
OOS period – Test 2
The IS dates will be from 1/1/2002 to 12/31/2011, which gives us 10 years of data and bull/bear market cycle. For the OOS sample period, I will use the last 5 years from 1/1/2012 to 12/31/2016. This captures only a bull market. How will this change results?
The analysis is going to be quick since I covered the details above. Here is the range for the CAR for each decile IS.
First let us evaluate for single variation. Of the 100 in the top decile how many passed our metric?
Only 24% of the variations passed the metric “CAR is more than twice the CAR of buying SPY when above MA200 and selling when below it.” We have a 76% chance of picking a variation in the top 100 that did not pass this metric
While 34% of the variations passed the metric “the ranking in OOS is in the top 20% of the 1000 variations.” One had 66% chance of picking a variation that did not pass this metric.
How did each decile perform in the OOS data?
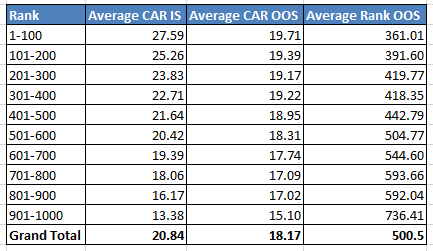
Here we only see a slight degradation in the CAR overall.
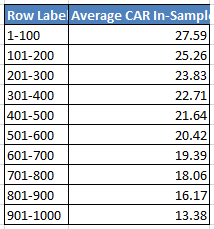
The top decile had an average OOS CAR of 27.59 which 2.5 times better than my simple MA200 strategy on the SPY. For “over 40% chance that a top decile variation is in the top 20% in OOS” metric we get a 34% chance. Short of passing. For “less than 10% chance that a top decile variation is in the bottom 20% in OOS” metric the value is 8%, just passing.
For the metric, “the chart of the top 100 in IS and what decile they end up in OOS looks good.”
This is an okay looking chart.
Given these four metrics, the top decile passed 2 of them easily, barely passed on one and failed on the last. I would still give it pass but not as strong compared to the first date ranges.
This shows how one splits the data can change the OOS one gets.
Random Strategy
For fun, I created a completely random entry and exit strategy. I controlled the randomness to give me similar exposure percentage and average holding periods. This chart is just like the previous ones.
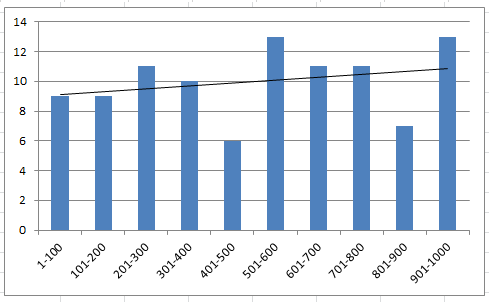
Here we see a basically flat linear regression line which is what we would expect.
Spreadsheet
Fill the form below to get the spreadsheet with the date used to generate all the above stats and charts. Warning though. This is a raw spreadsheet with lots of numbers and tables. If you want to see how I went about determining the buckets in Excel, this would be a great learning experience.
Final Thoughts
Using the top decile to decide if your strategy concept holds up in OOS is a much better way of testing. It is more important to me to know if my strategy concept is holding up than if one particular variation is. How to pick that one variation such that it is likely to hold up OOS, I don’t know how. I plan to explore some ideas in a future post. This is why larger funds will often trade lots of variations of the strategy in order to get rid of the luck factor. If we traded the top 100 during the OOS we would have had a CAR of 26.5. But if we picked one, it could have been as low as 14.4. Understand the role of luck when picking that one variation to trade.
Would Walk-Forward testing get around all these problems? It introduces a different set of issues which I plan to explore in a future post.
Backtesting platform used: AmiBroker. Data provider: Norgate Data (referral link)
Good quant trading,

Fill in for free spreadsheet:

