
- in Mean Reversion , Stocks by Cesar Alvarez
Using recent returns for Mean Reversion
In most of my mean reversion posts, I use RSI(2) to determine if a stock has sold off. In this post, I will explore how to use a stock’s recent return to determine if it has sold off. This will be done in way to normalize the return between low and high volatile stocks. This basic strategy has only two setup rules.
Rate of Change
We will be using Rate of Change (ROC) of the closing price. The formula is:
ROC(length) = 100*(today’s close / the close length days ago – 1)
Here is recent data on the S&P-500 index
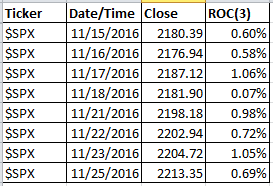
A ROC(3) which is the 3 day rate of change, would be
ROC(3) = 100 *(today’s close / the close 3 days ago – 1) and for 11/25/2016 it would be
ROC(3) = 100 *(2213.35/2198.18 – 1) = .69%
Potential Issues with ROC
One could simply have a buy rule that ROC be less than -10% to determine if a stock has sold off. The potential problem with this is that for a high volatile stock this may not be a very big sell off. But for a stock with low volatility this may rarely happen. How do we normalize this so we get signals that make sense for both low and high volatile stocks?
PercentRank
What we want to know is how does the current ROC(n) compare to the past ROC(n) of the stock. In particular I want to know where does the current ROC(n) rank over all the ROC(n)s over the last year.
For AmiBroker users, I am using the PercentRank formula. This is how AmiBroker defines it
Returns percent rank (0…100) of the current element within all elements over the specified range.
A value of 100 indicates that the current element is the highest for the given lookback range, while a value of 0 indicates that the current value is the lowest for the given lookback range.
Walking through an example should make it clearer. Example of PercentRank of ROC(3) over the last 30 days using the S&P-500.
In the “ROC(3)” column we have all the 3 day returns for the last 30 days. Next we want to know what is the PercentRank for the return on 11/25/2016. For each of the last 30 days we enter a “1” under the “Count?” column if that day’s return is less than or equal to the return on 11/25/2016 of .69%. Next we add up the values over the last 30 days. Here we have 20. We then take this total and divide it by the look back period of 30. PercentRank = 100*(20/30)=66.67%. This tells us the 3 day return on 11/25 is better than 66% of the returns over the last 30 days.
Since we are looking for a sell off and I want to compare to over the last year, we want PercentRank over the last 252 days of the ROC(3) to be less than 15. Clear as mud? If this does not make sense, ask questions in the comments below.
The Strategy
Setup
- Stock is member of the Russell 1000 index
- The price of the stock is greater than $1. Want to avoid very low priced stocks
- The 21 day moving average of Close time Volume is greater than $10 million. Want to make sure there is liquidity.
- The close is above the 100 day moving average.
- The 252 day PercentRank of the 2 day returns is below 5
Buy
- Enter at a limit price today at 1/2 of ATR(10) below previous close
- 12.5% of portfolio in each position
- Only enter orders so if they all fill will not have over 8 open positions
Sell
- 2 period RSI greater than 40
- Exit on next open
Nothing fancy here. Simple setup, entry and exit rules.
Results
Dates: 1/1/2006 to 10/31/2016
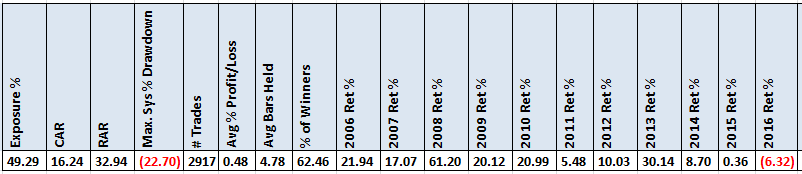
(click image to enlarge)
These are some decent looking numbers given the rules. Unfortunately like a lot of stock mean reversion strategies, the last couple of years have not been that great.
Spreadsheet
Fill the form below to get the spreadsheet with lots of more information. This includes other values for parameters ,yearly breakdown, worst 5 drawdowns and more statistics.
Final Thoughts
Is this strategy good enough to trade as-is? Not really. The spreadsheet has variations with better returns. One can take these ideas and improve on them. I wanted to show another way of measuring a sell off.
Backtesting platform used: AmiBroker. Data provider:Norgate Data (referral link)
1/4/2017 Additional research on this strategy, N-Day exits with Mean Reversion.
Good Quant Trading,

Fill in for free spreadsheet:

