
- in Mean Reversion , Rotation , Stocks by Cesar Alvarez
Weekly Mean Reversion Rotation Strategy on S&P500 Stocks
A reader emailed me about testing a weekly mean reversion rotation strategy on S&P500 stocks. My first thought was, why had I not done this type of test before? The very first strategy that I worked on with Larry Connors was this type of strategy. The strategy I will be testing today is a simpler version and different universe but how well will it hold up?
Basic Rules
Testing period is from 1/1/2007 to 10/31/2017.
Setup
- Stock is a member of the S&P500 index
- Stock is trading above its 200-day moving average
- The SP500 index is trading above its 200-day moving average
Each weekend, take all the stocks that have setup and then rank using one of the mean reversion methods below. Buy top 5 that are most sold off. Hold 1 week and sell. Then buy the ones that are now the most sold off
The second rule is to keep us out of stocks that keep falling. The third rule is to keep us out of bear markets. These types of strategies tend to get killed in bear markets. During a bull market, the strategy is fully invested in the most sold off stocks each week.
RSI Ranking
Of course, the first thing I tested was using RSI for ranking. I tested using 2,4,10, 14 day RSI. Ranking from low to high.
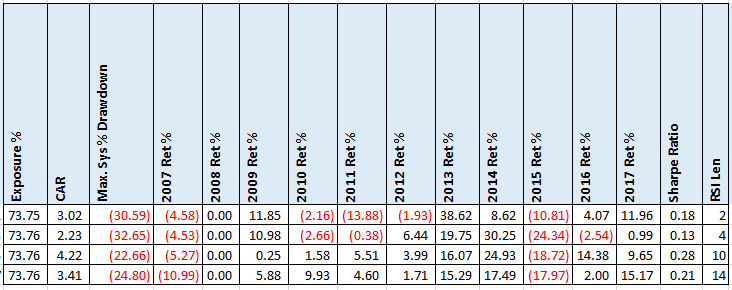
These are not the results I was expecting. They all did poorly.
Rate of Change (ROC) Ranking
Now the stocks are ranked by their (1, 3, 5, 10, 21) day return. From low to high.
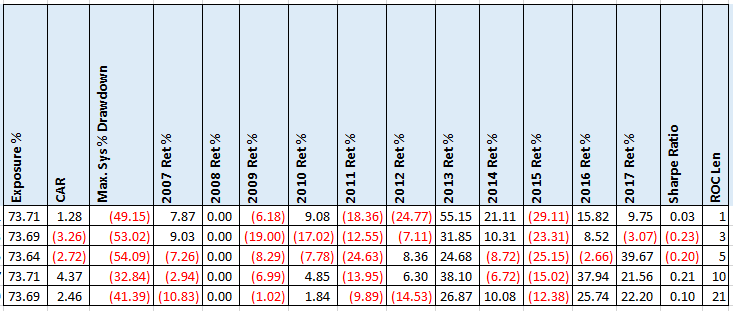
Again, very poor results. A double check of the code confirmed that these are correct.
Closing Range Ranking
Next up is one of my favorite indicators that is not used much. Closing range calculation is: (today’s Close minus the lowest low over the last N days) divided by (highest high over the last N days minus lowest low over the last N days). Again, we rank from low to high. Values for N tested are (1, 3, 5, 10, 21) days.
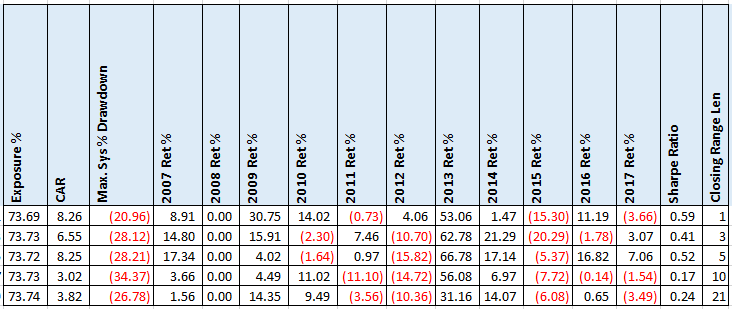
Now the strategy is getting somewhere. The CAR of 8.26 may seem good but are we seeing some higher numbers because of luck?
Random Ranking
Something to be aware of when doing these type of strategies where ranking is the main characteristic, is how much better is the ranking versus random ranking. I ran 1000 variations using random rank. The average CAR of these runs was 4.30 with a standard deviation of 2.54. This is informative. Both RSI and ROC ranking don’t do better than random. While the best runs of Closing Range are only 1.56 standard deviations away. Still not very good.
Ranking from high to low
Maybe ranking from high to low will improve the results. In the spreadsheet, I have shown these results. There is one run that has a CAR that is 2.44 standard deviations from the average. Can you guess which one?
Spreadsheet
Fill the form below to get the spreadsheet to see the results of using ranking from high to low and low to high, using a maximum of 5 and 10 positions, and lots of stats.
Final thoughts
Even though this was not the original strategy that I worked on, I was expecting much better results. The fact that most of the runs did not beat the average random run was really surprising. But even the best run has only average % profit/loss per trade of .28% which is a very tiny amount. Trading slippage would likely eat most of this away. The big lesson here is always test against random ranking when rank is an important part of the strategy.
Backtesting platform used: AmiBroker. Data provider: Norgate Data (referral link)
Good quant trading,

Fill in for free spreadsheet:

