
- in Mean Reversion , Research , Stocks by Cesar Alvarez
Adding candlesticks to mean reversion setup in a portfolio
In my previous post, Adding candlesticks to mean reversion setup, we looked at how various candle patterns could help individual trades. Now we will see how those results translate to a portfolio. And why I usually only do portfolio level testing.
The Strategy
Setup Rules
- Stock is a member or was a member of the Russell 3000
- The Dollar Volume of stock is greater than $500,000
- Close is above $1
- Close is above the 200-day moving average
- The 2-period RSI is below 5
Place limit orders 4% below close for the next day. Limit portfolio to 10 stocks. Rank signals from high to low using 100-day historical volatility
Sell Rule
- The 2-period RSI closes above 70, exit on next open
- If in position after 10 trading days, exit on the next open
Base Results
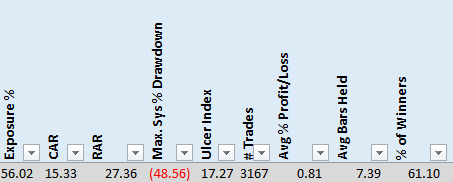
These are results we want to improve on.
Candlestick Patterns
This list includes both bullish and bearish candle setups. I tested both because who knows which patterns will work.
- Bullish Engulfing
- Bearish Engulfing
- Piercing Line
- Hammer
- Hanging Man
- Inverted Hammer
- Shooting Star
- Black Spinning Top
- White Spinning Top
- Bearish Abandoned baby
- Bearish Evening Doji Star
- Dark Cloud Cover
- Three Outside Down Pattern
- Bullish Abandoned Baby
- Bullish Morning Doji Star
- Three Outside Up Pattern
- Bullish Harami
- Three Inside Up pattern
- Bearish Harami
- Three Inside Down Pattern
- Three White Soldiers
- Dark Cloud Cover
- Three Back Crows
Change to Strategy
The candlestick pattern must occur within the last three bars of our setup.
Results
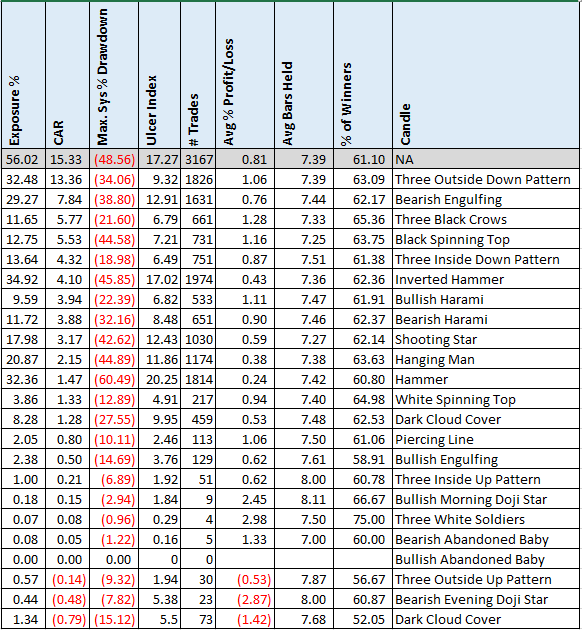
As in the previous post, requiring a particular pattern greatly reduces the number of trades. A few patterns improved the avg % p/l but at a cost of the number of trades. What was hinted at doing the all trades test in the previous post now becomes obvious in the portfolio test. Looking for a particular pattern reduces are trades too much.
The best pattern was the “three outside down pattern” which was one of the best patterns from the previous post. This pattern basically looks like 2 down closes which is a common rule in mean reversion strategies.

The “black spinning top” which we saw in the previous post improved the numbers at a huge trade reduction does the same on the portfolio level test.
Avoiding a pattern
Instead of looking for a pattern within three bars of the setup, what if we avoid a pattern? For example, we do not want an “Inverted Hammer” happening in the last three bars of the setup.
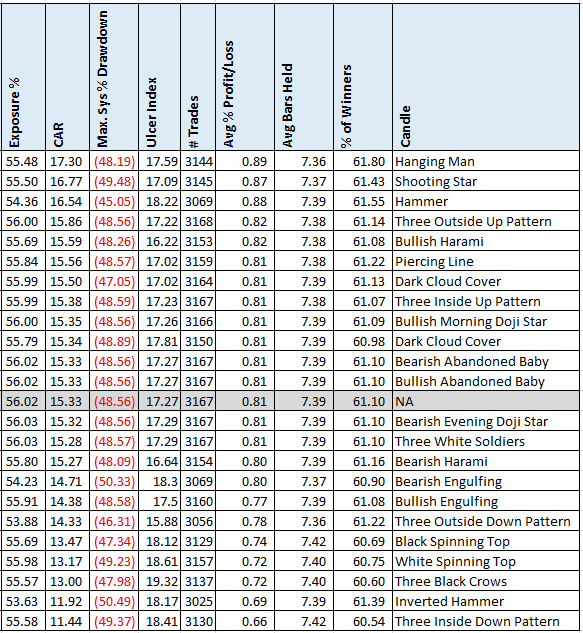
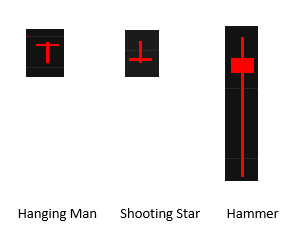
Now more patterns improve the results but only marginally. If you look at the number of trades, we can see only a small reduction in the number of trades. The three patterns that improved the results the most are “hanging man,” “shooting star” and “hammer.”
This is interesting because these results differ greatly from the previous post where “Inverted Hammer” and “Bearish Engulfing” improved the results the most. This is the main reason I test on a portfolio level rather on individual trades (like the previous post). The results do not always translate from one to the other.
Now as to why these patterns should be avoided, I can’t think of a good reason. But they all do look similar. Closing near the open and with a long tail is the commonality. Or is it simply overfitting these patterns to remove a couple of bad trades?
Spreadsheet
Fill in the form below to get the spreadsheet with all the data. Also included is the AmiBroker code for these patterns you can use in your code. The code is a sample.
Final Thoughts
One could try and change the RSI(2) setup rule to be looser. Something like RSI(2) < 10, which would cause more stocks to pass that filter and then maybe one could get enough trades when adding/avoiding a candlestick pattern.
Even if one pattern did improve the results, I would be very cautious of using it because we just tested 27 patterns to see which would work. This is where overfitting comes in. Just randomly testing stuff to see what works without a theory behind can be dangerous.
We can also see that the results from the previous post do not transfer to the portfolio tests in this post. I prefer to test at the portfolio level because this is how I trade. Often the results at the all trade level do not transfer to the portfolio.
Backtesting platform used: AmiBroker. Data provider: Norgate Data (referral link)
Good quant trading,

Fill in for free spreadsheet:

