
- in Mean Reversion , Research , Stocks by Cesar Alvarez
Be Careful of Big Years
While doing research on a mean reversion strategy, I was really happy with the Compounded Annual Returns (CAR) of 51%. I was thinking, I may have a new strategy to add to my stable of trading of trading strategies. A big fact I liked was the strategy used no market regime filter.
Then I looked at the yearly returns. The 2020 return through July 31 as 444%! How much did the CAR depend on this year’s numbers?
The Strategy
The reason for my start of looking into this strategy was I was wondering how some basic mean reversion ideas did during this recent sell off and bounce. The strategy focuses on lower liquidity stocks therefore I will be giving no rules. Conceptually it is a basic mean reversion strategy. Wait for a stock to have a sell off, buy. Then when it bounces, sell. The test range is from 1/1/2007 to 7/31/2020.
Initial Results
When initially testing an idea, I simply look at CAR and Maximum Drawdown (MDD) as my main statistics before diving deeper into a strategy. After testing a couple of ideas and running a small optimization, I noticed I was getting a CAR of 51% with an MDD of 35%. These results were much higher than expected, which means I think have made a mistake in my code and must be looking into the future.
The strategy is so simple, that I cannot believe I made a mistake. But I spend time checking and double checking my code and all looks good.
Onto the next step of my strategy evaluation which is looking at the yearly and monthly returns.
Yearly Returns
When looking at yearly returns, I want to see consistency on the up years. Meaning are they relatively about the same? Under what market conditions is the biggest up year? When we have had similar market conditions are those years also up big? Is the biggest up year substantially bigger than the second one?
Here are the yearly returns.
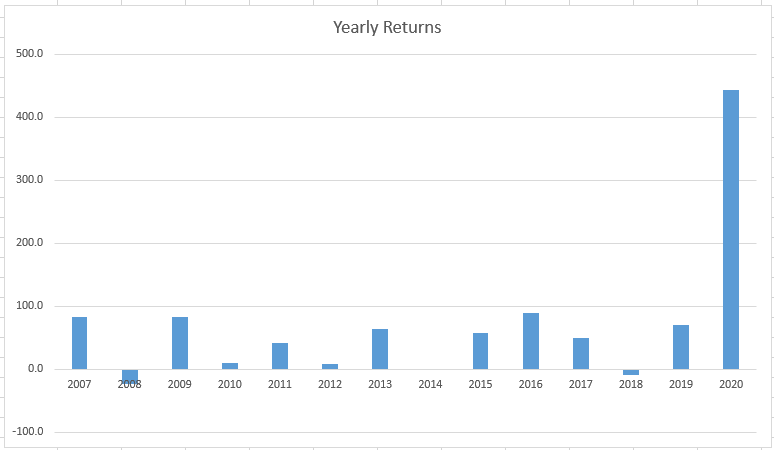
One of these is bigger than the others. The 2020 return of 444% is the YTD return not the annualized return. Clearly this strategy has had an amazing year and greatly influenced the CAR. Looking closer at the annual returns I see that there are 3 years of returns between 80 and 100%. And 4 years of between 50 and 80%. This strategy has lots of good years, but this year is clearly an outlier and one not to expect to happen again.
Monthly Returns
Now I want to know when did the big returns happen this year and did similar market conditions produce large returns?
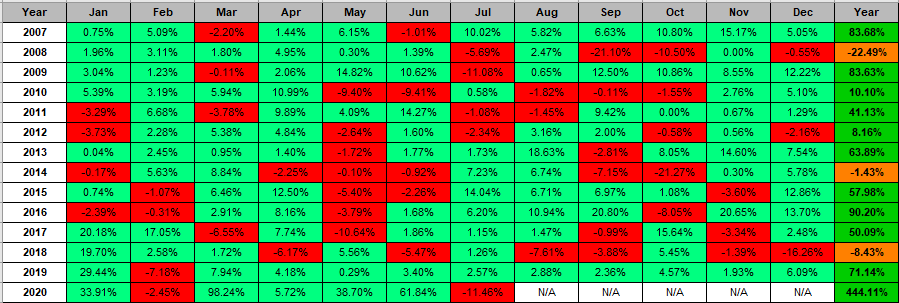
Looking at the returns for 2020, we see that March had a 98% return during the big bounce. The last time we had a big market sell off followed by a big bounce was the December 2018 sell off and the January 2019 bounce. January 2019 return of 29% is biggest monthly return before this year. There is the 2011 sell-off from May to September with a bounce in October 2011. The strategy made 9% in September and 0% in October. Not exactly big numbers.
The strategy was up 20% in November 2016 and January 2017 and the market was up each month about 3%.
There appears to be a little correction on the market returns vs strategy returns. Next, I calculate the monthly correlation of the strategy vs the $SPX which gives a correlation of 0.00. I like that.
Results Through 2019
What is a more realistic CAR for this strategy? Given that 2020 is such a huge outlier, I run the test through 12/31/2019. This gives a CAR of 35.14% with an MDD of 35.15%. These are very respectable numbers.
Final Thoughts
My first thought is why did I not test this test idea last year? It would have been nice to get those 444% returns this year. That is the life a researcher, finding great strategies after the fact.
Will I trade this strategy? Not yet because I want to do more analysis. In particular, I want to add slippage to the results. The strategy enters on the open which for smaller stocks can have a lot more slippage than the larger stocks I typically trade. These test results use $.05/share for commission and $.05/share for slippage. I want to add a percentage amount of slippage to the entry and exit price.
Adding this may make the results a lot less enticing because the CAR will drop and MDD will increase. Probably a future post.
Backtesting platform used: AmiBroker. Data provider: Norgate Data (referral link)
Good quant trading,

