
- in Research , Rotation , Stocks by Cesar Alvarez
Different ranking methods for a monthly S&P500 Stock Rotation Strategy
Recently for my own trading, I have been researching rotational strategies on both the weekly and monthly timeframes. The most common indicator that I use for ranking stocks is Rate of Change (ROC) of the closing price. I read about using Rate of Change on the EMA to rank stocks. I liked a small twist on the idea and wanted to know how it compared to what I am using.
Then this led me down another path of trying other ranking methods with an interesting result using historical volatility (HV) that I did not expect.
Base Rules
Backtest from 1/1/2007-12/31/2020.
Buy
- It is the last trading day of the month
- Stock is a member of the S&P500 index
- Stock is above the 200-day moving average (spreadsheet has results without this rule)
- The $SPX is above the 200-day moving average
- Rank stocks from high to low using the (63, 126, 189, 252) Rate of Change of close
- Buy the 10 highest ranked stocks (spreadsheet has results using 5 highest)
- Enter at the open on the next trading day
Sell
- Sell all stocks on the open of the first trading day of the month
Base Results – Rate of Change on Close
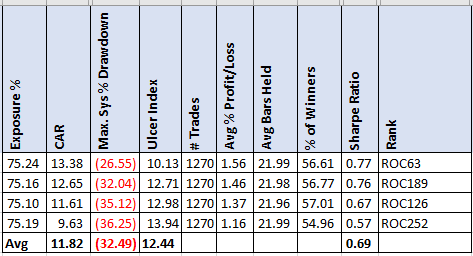
Not exactly the best results but this gives us something to compare against. I will be using the average of these results to compare against the other rankings.
ROC on EMA
Now we will change the ranking to be the highest ROC of the EMA. We will use the same length parameter for ROC and EMA. In AmiBroker this would look like: ROC(EMA(C, 63), 63).
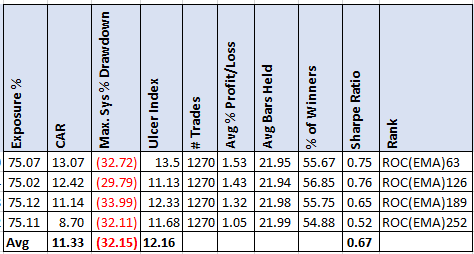
Well, that did not change the results much. I was not expecting a big change but I never know until I test it because half the time I am wrong.
ROC divided by HV
This then got me thinking about other twists on ranking methods. Maybe I wanted those stocks that have gone up the most with the least volatility. Basically, the smoothness of the returns. There are other methods like Sharpe Ratio and linear regressions that I have tried in the past with no success. Then I thought of my favorite ranking function, Historical Volatility. What if I did something simple and divided ROC by HV. If two stocks went up the same amount, this would favor the stock with the lower HV.
Here is the HV formula I use for AmiBroker
function HV(len)
{
     return StDev(log(C/Ref(C,-1)),len)*(252^.5)*100;
}
The AmiBroker ranking code then looks like this ROC(C,63)/HV(63)

That was a bust for the CAR and Sharpe Ratio. As expected, the MDD did come down since I was favoring lower HV stocks. But when I see negative results like this, then the next obvious thing is to try the opposite.
ROC times by HV
Now we try ROC times HV. Now if two stocks have gone up the same amount, now this favors the one with higher HV.
The AmiBroker ranking code looks like this ROC(C,63)*HV(63)
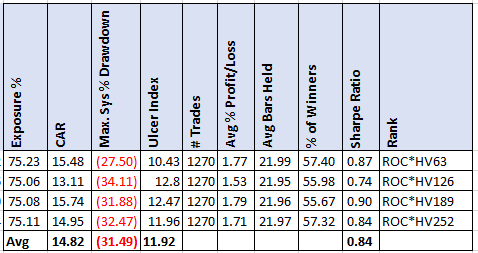
Wow this did better than expected. CAR is up 25%. Sharpe ratio is up 22%. While MDD & UI are slightly lower.
HV Only
At this point, comes the obvious test. What if you use HV only?
The CAR is almost as good at ROC*HV but the MDD is much higher. I was really expecting this one to do better.
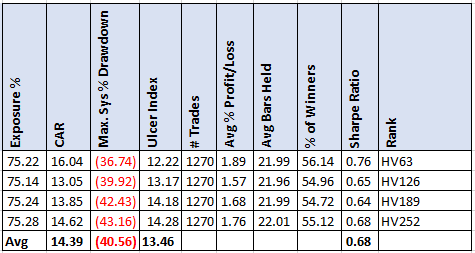
Very interesting results. Not what I was expecting
Spreadsheet
Fill in the form below to get the spreadsheet with lots of additional information. See the results of all variations from the optimization run. This includes top drawdowns, trade statistics and more.
Final Thoughts
This is the way my research often goes. I start with one idea (using EMA on ROC), and then slowly morph to other ideas. And if I am lucky, I discover something interesting like I did this time. I have some rotation strategies that I trade now. I will have to check and see what ranking there are using and try instead using ROC*HV.
If you trade momentum rotational strategies, I would definitely try this.
Reader’s suggestions on this post: More ideas for ranking methods on a monthly S&P500 Stock Rotation Strategy
Other blog posts on rotational strategies: Monthly S&P500 Stock Rotation Strategy and S&P500 Monthly Rotation-Readers’ Ideas.
Backtesting platform used: AmiBroker. Data provider: Norgate Data (referral link)
Good quant trading,

Fill in for free spreadsheet:

