
- in Research , Rotation , Stocks by Cesar Alvarez
Inverse Volatility Sizing Index
In my last post, Inverse Volatility Position Sizing, I tested inverse volatility sizing on a monthly rotation strategy. I saw very little difference in the rest results versus equal position sizing. I was talking to a trading friend about the research and how I was surprised at how there was not any difference in the results. He suggested creating an index using this method.
Now, this sounded like an idea with good potential. And even better it should be easy to test since I had the code written already.
Or Not
What I thought would be a few minutes to test this turned out to be a couple of hours. It turns out dealing with the 100 or 500 positions and making sure you don’t run out of money to get into them all was a little more work than expected. The joys of coding. Nothing is as simple as you think it will be.
The Rules
Test date range 1/1/2007 to 12/31/2019. Since I am trying to create an index, I assume no commissions. All results include dividends.
Buy Rules – Weekly
- It is last day of the week
- Stock is member of the Nasdaq 100
- Buy all members of the index at the close
Size using Inverse volatility sizing (IVS) using [10, 20, 50, 100] day historical volatility.
Sell Rules
- It is the last day of the week
- Sell on the close and rebuy the positions
The Metrics
Since the general claim is that risk is reduced using IVS, I will be focusing on Maximum Drawdown, Ulcer Index and Sharpe Ratio. But keeping an eye on Compounded Annual Growth Rate.
We will be comparing results to buy and hold on the QQQ & SPY, both cap-weighted indexes. The reason for this choice versus testing equal weight again was that I wanted to see if we could beat the ETF. Maybe create a better ETF?
Results – Nasdaq100 – Weekly – HV
I started with the Nasdaq 100 and resizing weekly because I was afraid of running times.
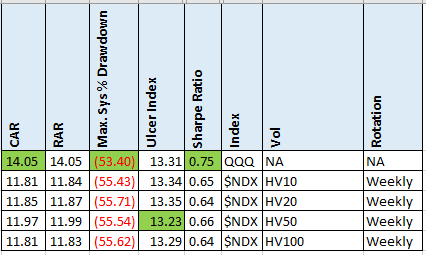
Green cells are the best values.
Not a good start. Two possible issues. One is the method for determining volatility. Two is the rotation time.
Results – Nasdaq100 – Weekly – ATR
Next, I am trying a different method for volatility which is Average True Range as a percentage. The formula is
ATR_PERCENT = Average True Range of N days divided by the N-day moving average of the close
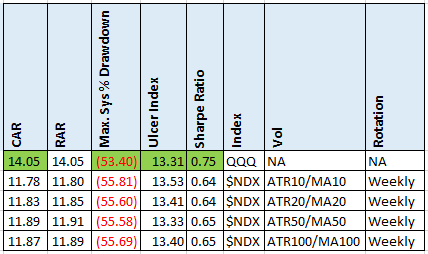
No real change in the results.
Results – Nasdaq100 – Daily – HV
Using Historical Volatility as the volatility measure, now let us see if rotating each day makes a difference.
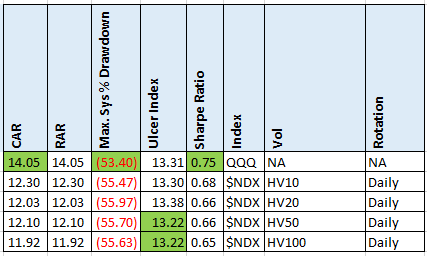
Clearly IVS is not reducing risk on the Nasdaq 100 stocks. Because of the ‘small’ number of stocks, I thought it might work here.
S&P500 – Weekly – HV
Next, I tried the S&P500 stocks but not expecting much difference because of the higher number of stocks.
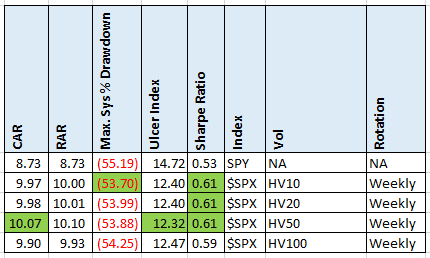
Surprise. Surprise. Buy and hold does not have the best metrics. But the stats did not change in the way I expected. CAR went up while MDD stayed about the same.
S&P500 – Daily – HV
Will this hold up using daily rebalance?
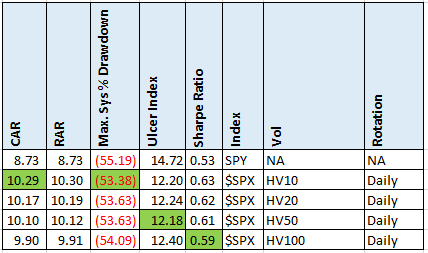
Yes it does.
Spreadsheet
Included is monthly rebalancing.
Fill in the form below to get the spreadsheet with lots of additional information. See the results of all variations from the optimization run. This includes top drawdowns, trade statistics and more.
Final Thoughts
Was I expecting to get results for a strategy to trade? No because of the assumptions of trading at the close and no commissions. Most people could not trade this idea.
I wanted to know if using these rules would lead to Inverse Volatility Sizing having better results than buy and hold of the ETF. As stated in the previous post, I have read and talked to many people who use IVS so I am looking for the situation where it clearly works better. Not here
Backtesting platform used: AmiBroker. Data provider: Norgate Data (referral link)
Good quant trading,

Fill in for free spreadsheet:

