
- in General , Market Timing , Research by Cesar Alvarez
SP-500 Seasonality
I’ve been seeing lots of seasonality type charts on the S&P500 where they take the average return for each day of the year and then create a return curve for the year. The chart often ‘shows’ the sell in May and buy in November flatness of the returns. And then the holiday end of the year run up.
Steven, my trading buddy, sent me yet another chart and I noticed something I had not seen before. A beginning of the year downtrend from January to mid-March. This got me thinking. How much does the start of the data set impact these charts?
Replication
First, I wanted to replicate the chart I saw which stated it was using data since 2000 and ending on 12/31/2020. There are two general ways that I have seen this done. Method 1 uses the trading day of the year. Method 2 uses the trading day of the month. I like trading day of month because it is easy to look at the chart and determine when a particular point in time a data point is. Using the trading day of the year, I need to take the number and divide by 21, to get the month, and then I can figure the point out. A little messier. I did try both methods and they do give basically the same curve.
Creating the chart is fairly simple. For each day, I calculate the average return on that day for all the years in data set. Once that is done, then I start with 100 (arbitrary number) and take each day’s return to calculate the curve.
Results Since 2000
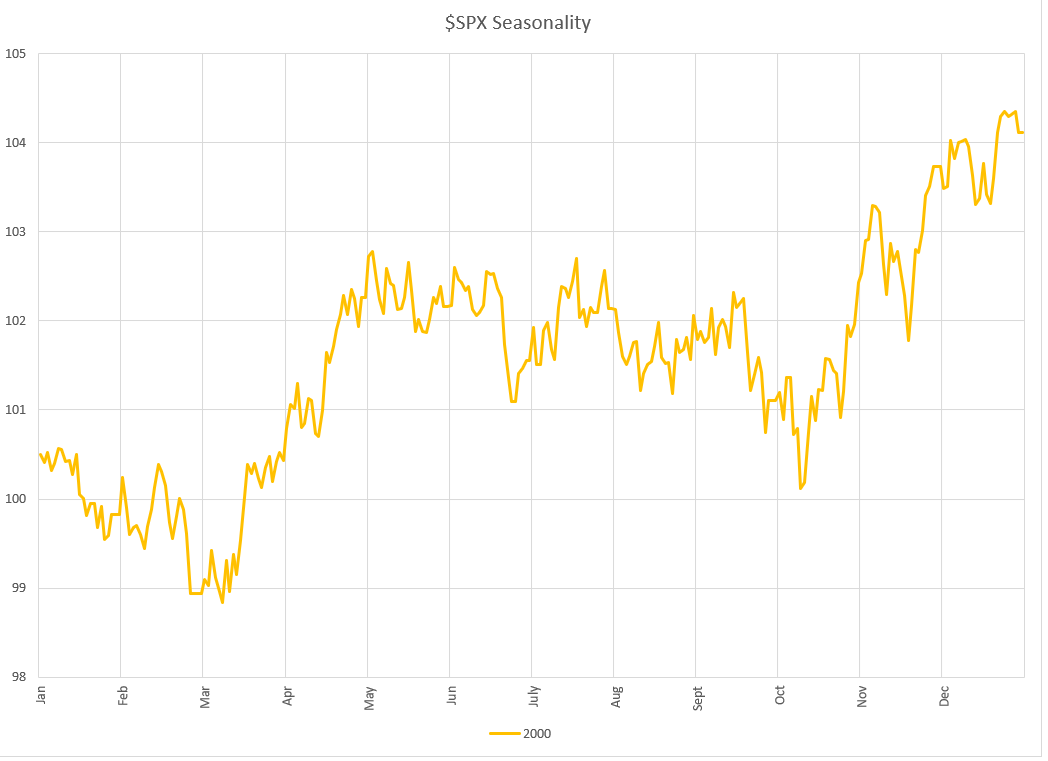
This curve closely replicates the results I saw, which is good.
You can clearly see the May to October general flatness in the market. Then a big a run up from mid-October to the end of the year.
What did surprise me (at first) was the sell off from the start of the year until early March. And then the bounce until May. Then thinking back on my 25 years of trading, I remembered about three serious market sell-offs at the beginning of the year.
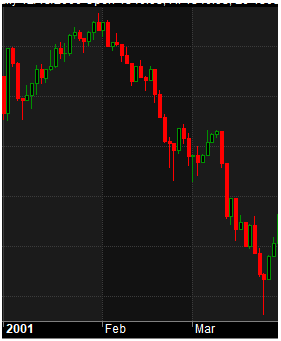
2001 Bear Market
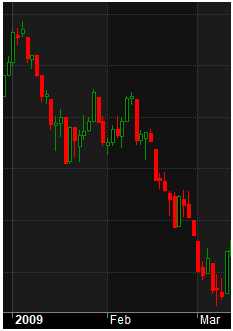
2009 Great Financial Crisis
2020 Pandemic Sell-Off
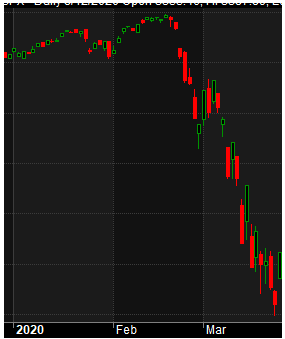
These huge sell-offs also produced big returns from mid-March to May.
Results Since 1980, 1960, 1940
Now, what happens as we add more data? Do these general trends hold or do they change?
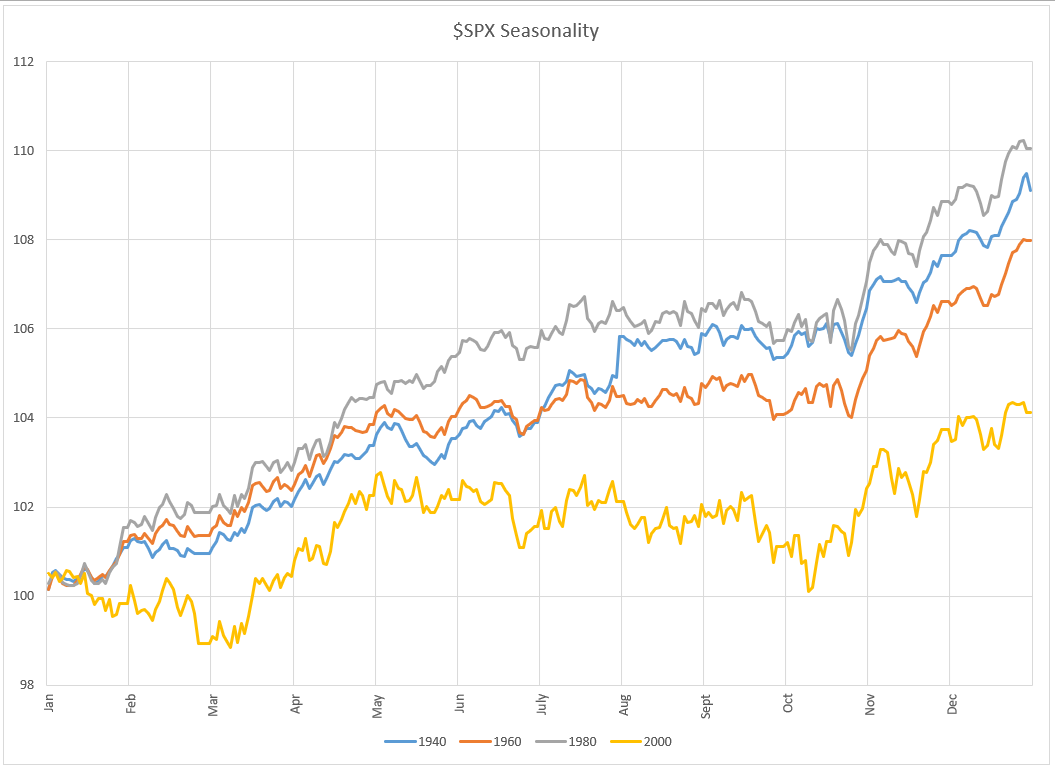
The beginning of the year sell-off from January to mid-March is no longer in the three new start years. Now the markets are up.
The mid-year slump from May to October? It is there using data since 1960. But for the 1940 and 1980 data, there is a clear uptrend.
The end of the year run from November to the end of the year. That is in all years.
Final Thoughts
We can see how much a different conclusion you can get on the market seasonality depending on how far back you go. The only real ‘constant’ is the end of the year rally.
I can make good arguments for and against each of the start years. None of them is a wrong one or a right one. This is discretionary and we can see different results based on our choice. A reader brought this up in my previous post, that had I used a different start date, I would have seen different results.
My general rule is to try to be consistent. So most of my studies start either in 2000 or 2007.
How would I use this information? I would likely not because of the small sample size and the changing markets over the years. Our current markets differ greatly from 1980 to 2000. And even more so before then. One possibility suggested is using this as one input into a market timing indicator or strategy.
The next time you see one of these charts, your first thought should be what if it started earlier or later.
Backtesting platform used: AmiBroker. Data provider: Norgate Data (referral link)
Good quant trading,

