September 14, 2022

Three Factor ETF Rotation Strategy

I am drawn to ETF rotation strategies. What likely draws me to them is that in general, these are simple strategies that do not trade that often. My goal with these strategies is to match buy and hold with less drawdown.

What follows is a strategy I have known about for a while and tested but never written about.

Correction on January 18, 2023

This post was corrected on January 18, 2023, after an error was discovered in the code. What is rare, the results with the correct code are better.

The Concept

From a set of ETFs, select the one to three that have had the best short-term return, best mid-term-return with the least volatility.

The Ranking Formula

Step1

  1. Calculate the 3-month return for each ETF
  2. Calculate the 20-day return for each ETF
  3. Calculate the 20-day historical volatility for each ETF

Step2

  1. Rank ETFs from Step 1A from high to low. Give the top-ranked ETF a value of 1. The next one is a value of 2, etc. and the last one a value of N. N being the number of ETFs in the trading universe.
  2. Rank ETFs from Step 1B from high to low. Give the top-ranked ETF a value of 1. The next one is a value of 2, etc. and the last one a value of N.
  3. Rank ETFs from Step 1C from low to high. Give the top-ranked ETF a value of 1. The next one is a value of 2, etc. and the last one a value of N.

Step 3

Final Rank Value (FRV) for each ETF is Step2A * 40% + Step2B * 40% + Step2C * 20%

The downloadable spreadsheet contains an example of how to do this ranking.

Universe

The tricky part about any ETF strategy like this is the selection of the trading universe. This has a huge impact on the results. I will test 2 universes for this post but if you have your own idea of a universe to test, add it to the comments below. If I get enough good universes, I will do another post with those results.

US Sector Universe: XLB, XLE, XLF, XLI, XLK, XLP, XLU, XLV, XLY

Asset Class Universe: SPY, EFA, IEF, GLD, ICF

Buy Rules

Test date range from 1/1/2007 to 6/30/2022.

  • Last day of the trading month
  • Calculate FRV for each ETF
  • Of the top (1,2,3) ETFs, only enter those trading above their 200-day moving average
  • Enter on next Open

The 200-day MA rule is used to avoid being in a highly ranked ETF trending down.

Sell Rules

  • Last day of the trading month
  • Exit on the next open

We exit all positions at the end of the month even if it is a buy. This has the effect of rebalancing each month.

Target Results

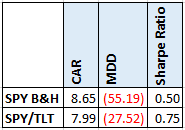
First, we need a target to beat. I have chosen two. First is buy and hold on the SPY. The second is 60% SPY/40% TLT rebalanced yearly.

US Sector Universe

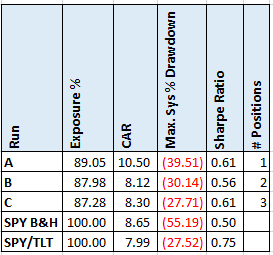
The three-position portfolio beat both the baseline portfolios in terms of CAR & MDD but not Sharpe Ratio. But not by much. Given the work I would stick with SPY/TLT overall. Granted that portfolio is getting killed this year. It is down 21% through June 30. The 3-position portfolio is doing much better this year only down .16%. The one position portfolio has a higher CAR but also a higher MDD.

Asset Class Universe

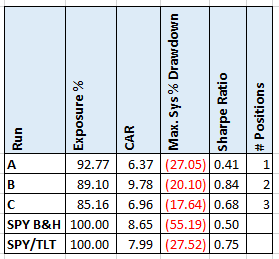
I was not expecting the CAR for this universe to match either baseline because of the assets. But I was expecting a lower MDD. The 2 and 3 position portfolios matched my expectations, though at a significant lowering of the CAR.

Asset Class Universe Optimization

I don’t know how the lookback periods and the weighting were chosen, which made me want to do an optimization on them. This is what I did.

  • (1,2,3) month return
  • (10, 20, 30, 40) day return
  • (10, 20, 30, 40) day historical volatility
  • (20, 30, 40, 50) % weight for monthly return
  • (20, 30, 40, 50) % weight for daily return
  • Historical volatility weight is what is left over from the previous two


Here are the top 15 results. You can get the full optimization run for this and the sectors universe by filling in the form below. I also added (1,2,3) positions to the optimization.

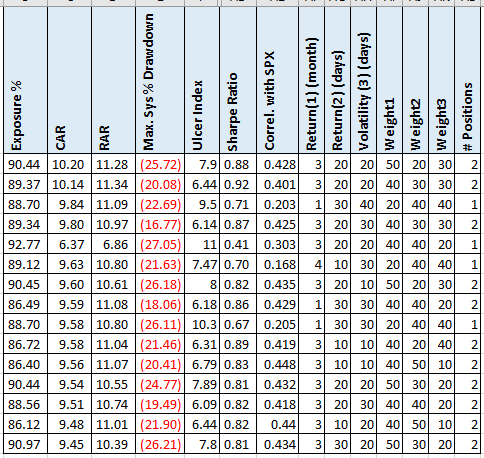
Now, these results are beating the baseline. A couple of things I notice:

  • The higher CAR tend to underweight HV.
  • The lowest MDD tend to overweight HV.

Spreadsheet

Fill in the form below to get the spreadsheet with lots of additional information. See the results of all variations from the optimization run. This includes top drawdowns, trade statistics and more.

Final Thoughts

Using the original rules there were no big surprises. But as I said at the beginning, the universe selection has a huge impact on the final results.

I was surprised at how well the top optimization runs performed. The weight of the HV changing the results as they did is something that I use all the time in my strategies. When wanting to lower drawdowns, I will focus on lower HV stocks.

If you have ideas for different universes to test out, put them in the comments below. If I get enough suggestions, I will do another blog post with these.


Backtesting platform used: AmiBroker. Data provider: Norgate Data (referral link)

Good quant trading,

Fill in for free spreadsheet:

spreadsheeticon


Click Here to Leave a Comment Below

tds frans - September 14, 2022 Reply

Hai Cesar,

can you send also the amibroker code for this strategy?

kind regards,
tds Frans

    Cesar Alvarez - September 15, 2022 Reply

    Sorry, but I do not share the code. If you wish to purchase the code, please use this link.

Donald Byrge - September 15, 2022 Reply

Great work, Cesar, as usual.

Fidelity has a great selection of over 40 actively managed sector and industry funds from which to build a viable universe. A list of them can be viewed here: https://www.fidelity.com/mutual-funds/fidelity-funds/overview

Looking forward a follow-up post soon.

    Cesar Alvarez - September 15, 2022 Reply

    Do you have a specific group that you want to be tested? The issue is not being able to find ETFs but what the combination of them should be.

Shawn Crichley - September 16, 2022 Reply

Thank you for the study! I use portfoliovisualizer to do these type of tests quickly. Just averaging the 1,3,and 6 month total returns in a dual momentum sort does well for asset class selection. The 1-3 months window seems to be a little short.

I like to use equal weight ETFs to enhance return. I add RHS,RYH, and RYU to minimize volatility. Then I add RYT as the 3 low vol sectors can all do poorly at the same time when bond rates are rising. I take the best 3 of 4 risk on assets and hold IEF when not invested. I prefer to sort the safety asset on momentum also, but this study just shows using IEF as the safe asset. The study starts 1/2008 as the ETF inception date does not allow a backtest all the way to 1/2007. –> https://bit.ly/3Bl0d8B

The multi-asset universe also does well with the 1,3, and 6 month dual momentum sort. Returns are in the 10% range with about 15% drawdown. Taking the best 3 of 5 major asset classes seems to do well here. –> https://bit.ly/3UfcqUZ

    Cesar Alvarez - September 19, 2022 Reply

    Thank you for sharing this. I will have to take a closer look at your portfolios.

Tom Kasperski - September 22, 2022 Reply

Great post Cesar. I have a couple of questions and suggestions for other universes to test.

1. What is the rationale/benefit to using rank values vs. just using a total return percentage in your relative strength calculations?
2. Using a 20-day return for your second relative strength period was surprising to me. I typically see better results when the shorter period is 2-3 months and longer periods are 6-12 months.

Here are some universes you might want to try:

US Sector Universe: XLB, XLE, XLF, XLI, XLK, XLP, XLU, XLV, XLY

Asset Classes Narrow: DBC, EEM, EFA, GLD, IWM, SHY, SPY, TLT, VNQ

Asset Classes Broad: DBA, DBB, DBE, EEM, EFA, GLD, IEF, IWD, IWF, LQD, QQQ, SHY, TLT, VB, VNQ, VSS

Equity Styles: EEM, EFG, EFV, FM, IWD, IWF, IWO, MTUM, VBR, VSS

Industries: BIZD, CARZ, FDN, IAI, IBB, IGM, IHF, IHI, ITA, ITB, IYG, IYT, JETS, KBE, KIE, OIH, PAVE, PEJ, PKB, SOXX, TAN, VNQ, XLB, XLP, XOP

Emerging Countries: ECH, EGPT, EIDO, EPHE, EPOL, EPU, EWM, EWT, EWW, EWZ, EZA, FM, GXC, KSA, THD, TUR, VNM

    Cesar Alvarez - September 23, 2022 Reply

    First, these rules were not generated by me so I will speculate on question 1. My view on using rank value vs return is that using rank this way long term outperformance does overwhelm short term underperformance. I have used both methods in my own trading. They simply give different but similar results. I have found neither way to be better.

    Given the short holding period of one month, I was not too surprised to see the 20-day return in the rule. This shorter holding period also acts as a kind of stop loss.

    Thanks for all the universes to try. I will have to look into how long these have been trading to see how far back I can test.

Tom Kasperski - September 23, 2022 Reply

Thanks for your responses Cesar. Below are the dates for each ETF. I would recommend removing FM, MTUM, BIZD, CARZ, JETS, PAVE from these groups in order to catch the 08 bear market. For EM, I would only ditch KSA and FM. This will allow you to backtest to 2010, missing the 08 bear, but catching a period where EM didn’t perform very well. As a side note, I would encourage you to backtest EM with volatility only. The low-volatility factor really works well for EM for some reason.

Asset Classes Narrow
DBC Feb-06
EEM Apr-03
EFA Aug-01
GLD Nov-04
IWM May-00
SHY Jul-02
SPY Jan-93
TLT Jul-02
VNQ Oct-04

Asset Classes Broad
DBA Jan-07
DBB Jan-07
DBE Jan-07
EEM Apr-03
EFA Aug-01
GLD Nov-04
IEF Jul-02
IWD May-00
IWF May-00
LQD Jul-02
QQQ Mar-99
SHY Jul-02
TLT Jul-02
VB Jan-04
VNQ Oct-04
VSS Apr-09

Equity Styles
EEM Apr-03
EFG Nov-05
EFV Aug-05
FM Sep-12
IWD May-00
IWF May-00
IWO Jul-00
MTUM Apr-13
VBR Jan-04
VSS Apr-09

Industries
BIZD Feb-13
CARZ May-11
FDN Jun-06
IAI May-06
IBB Feb-01
IGM Mar-01
IHF May-06
IHI May-06
ITA May-06
ITB May-06
IYG Jun-00
IYT Jan-04
JETS Apr-15
KBE Nov-05
KIE Nov-05
OIH Feb-01
PAVE Mar-17
PEJ Jun-05
PKB Oct-05
SOXX Jul-01
TAN Apr-08
VNQ Oct-04
XLB Dec-98
XLP Dec-98
XOP Jun-06

Emerging Countries
ECH Nov-07
EGPT Feb-10
EIDO May-10
EPHE Sep-10
EPOL May-10
EPU Jun-09
EWM Mar-96
EWT Jun-00
EWW Mar-96
EWZ Jul-00
EZA May-03
FM Sep-12
GXC Mar-07
KSA Sep-15
THD Mar-08
TUR Mar-08
VNM Aug-09

Richard Feit - December 27, 2022 Reply

The ETF TACK adds GLD, STPL, and SPTS to their ETF universe.

greg - January 18, 2023 Reply

I’ve used the ratio of jnk:iei – risk on if 10 day sma> 100 day sma; risk off if lower

risk on pick best (1) of rsp,qqq,dhs, dia using 3mo, 20 day, 20day vol

risk off pick best (1) of tlt, ief, bil, xlu using 6mo

i’m also using jnk:bil and jnk:shy with different ratios

let me know if you check this out

    Cesar Alvarez - January 18, 2023 Reply

    Creating risk on/off baskets is another method that I should write about. Thank you for sharing yours.

greg - January 18, 2023 Reply

forgot to add that we rotate monthly on the last trading day of the month

greg

Leave a Reply: