
- in ETFs , Market Timing , Research by Cesar Alvarez
Using Historical Volatility for Parameter Adjustment
The AllocateSmartly website often has interesting posts. Recently I was reading the article Trending Fast and Slow and thought about other ideas to test. The article is based on research on trading the SPX and depending on the current historical volatility one would either use a 12-month or a 1-month lookback to decide whether to enter or exit the trade. I had tried similar ideas before but not this one.
Now what is here is not a final strategy to trade, as stated in the original article, but still an interesting concept. I wanted to know how robust it is and test some variations.
Original Rules
As usual, the first step is to replicate the results. One problem I have is they included dividends. I do not have total return data for the SPX back to 1954. What I am looking for then are results with a similar CAR between the strategy and buy and hold and a MDD of less than half.
From the article, the 17% threshold for 21-day historical volatility is approximately the 80th percentile of HV values over the history of the SPX going back to 1954. Using my data, I got the same value.
Buy Rules
- It is the last trading day of the month
- Is 21-day historical volatility is less than 17?
- Yes: is the 12-month return greater than zero?
- No: is the 1-month return greater than zero?
- Enter on Close
Sell Rules
- It is the last trading day of the month
- Is 21-day historical volatility is less than 17?
- Yes: is the 12-month return less than zero?
- No: is the 1-month return less than zero?
- Exit on Close
Results from 1954
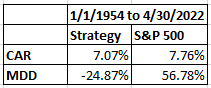
These results are in line with what I expected, which is good.
Results from 2000
The original research tested back to 1954, which is too far back for me. The markets have changed a lot since then. These are the results from 2000-2022.
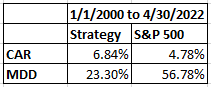
The strategy has performed well since 2000.
Different HV Values Test
The 17% was determined using data back to 1954. Since I want to focus on testing since 2000, I calculated the 80% value for the 21-day historical volatility since 1999, because I wanted a year of data before the start of the test. The 80% value for this period is 21.2, which is substantially different from the 17 value used. This is a concern.
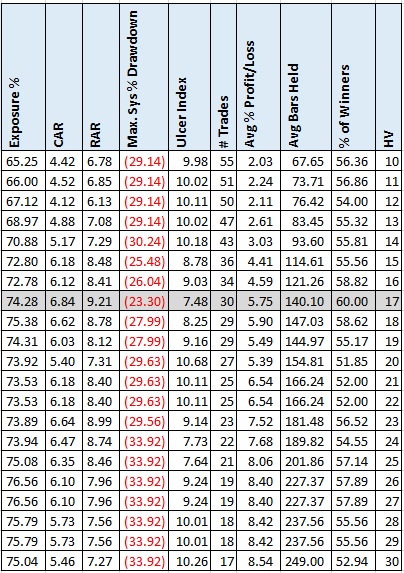
Running an optimization on HV cutoff between 10 and 30, we can see that the results between 15 and 25 are similar. The ‘bad’ is that 17 is both the best CAR and MDD which means it may be overfit.
It is good to see that the value of 21, which is what we get if use all data from 1999 to the present, produces good results.
Using Only Available Data
One thing that bothers me about this approach is that ‘high’ HV changes substantially through the years. Also, there is some future-peeking going on here because in 1975, for example, there would have been no way to determine the 80th percentile of HV values from 1954 – 2022. For those reasons, I wondered if maybe a dynamic threshold would be better. Here are the results of only using the available data at the time of the trade to calculate the threshold. For example, on the last day January 2007, we use all the data from 1/1/1999 to 1/31/2007 to determine the 80th percentile cutoff.
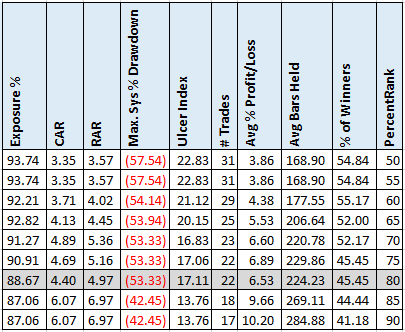
These results are horrible for 80%. Results are close to buy and hold. Even using 85 or 90, the MDD is close to buy-and-hold.
Rolling Lookback Window
What if instead of using all the available data, we instead use rolling windows. For example, only the last 10 years of data.
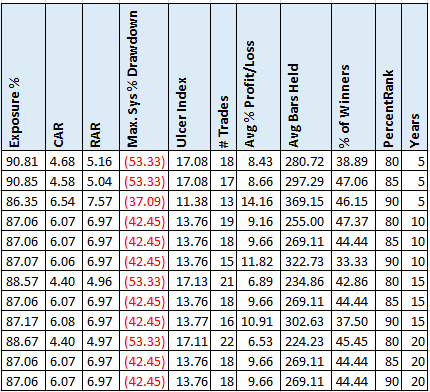
Percent rank of 85 or higher works well for all the lookback periods in terms of CAR. But in all cases the MDD is near buy and hold. Again, this is disappointing to see results so different from the initial hard value of 17.
Spreadsheet
Fill in the form below to get the spreadsheet with lots of additional information. See the results of all variations from the optimization run. This includes top drawdowns, trade statistics and more.
Final Thoughts
Conceptually I liked changing the rules based on HV. I did not like that the cutoff value of 17 was very different if we used data from 1999 forward, which produced a value of 21.
Normally testing with dynamic thresholds for an indicator will produce similar results to the static value version. Several of the dynamic variations achieved CAR of over 6%, which is close to the CAR when using static HV thresholds from 15 to 19. But in all cases, the dynamic threshold MDD was over 40%, compared to under 28% for the static variations.
My thoughts were to potentially add this concept to the dual momentum strategies that I trade, but given the inconsistency of the results, I will not be testing that.
Backtesting platform used: AmiBroker. Data provider: Norgate Data (referral link)
Good quant trading,

Fill in for free spreadsheet:

