
- in General , Research by Cesar Alvarez
Using Probability Cones to Test for Strategy Death
The most common question I get is how do you determine that a strategy is no longer working. It is also the question that I don’t have a good answer for. I have written several posts about this: Trading the Equity Curve, How to turn off a strategy using historical volatility, Broken Strategy or Market Change. During his How to detect a failing trading strategy presentation, Kevin Davey discusses how he uses probability cones to determine when to stop trading a strategy. I had not investigated this concept and was very intrigued.
Davey has a spreadsheet you can download at his site but the spreadsheet is not built for equity curves in the way I would use it. I built my own version of the spreadsheet that uses equity curves in the method that made sense to me.
The Concept
Probability cones encapsulate the statistical range of the future equity curve. Given your backtested equity curve, you can calculate the daily average return and standard deviation of these returns. The important part of this calculation is that you use the log values of the daily return. The reason for this is that a 1% up day followed by a 1% down day does not get you a 0% total return. This is what you would get if you simply sum the values. Taking the natural log of 1 plus daily return allows you add the values and get the correct total return.
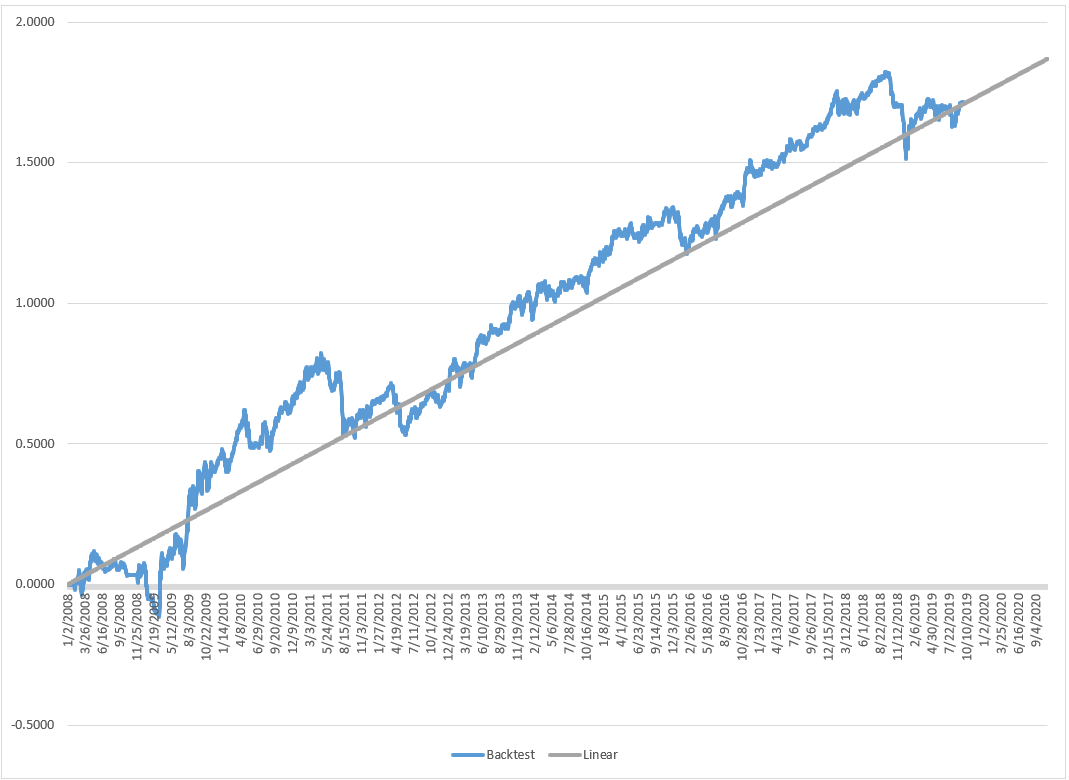
From the average and standard deviation, you can then draw the linear version of the curve from the start to the end of your data, as shown in the image below.
Now you need to add the cones. The value of any future point is given by this formula:
Future_value = last_value_of_equity + (avg_daily_return*period + sqrt(period)*(curve_sd*std_equity)
Where:
Last_value_of_equity: The last value of your backtested results. This is also the last value of your linear equity curve on the last day of your backtested results.
Avg_daily_return: This is the average of the natural log of the daily percent returns
Period: How many days from the last_value_equity that we want to calculate the curve value for
Curve_sd: For what standard deviation are we calculating the curve for. Typical values are -2, -1, 1, 2.
Std_equity: This is the standard deviation of the log of daily returns
The image below shows the curves with values of -2, 2 added to our chart.
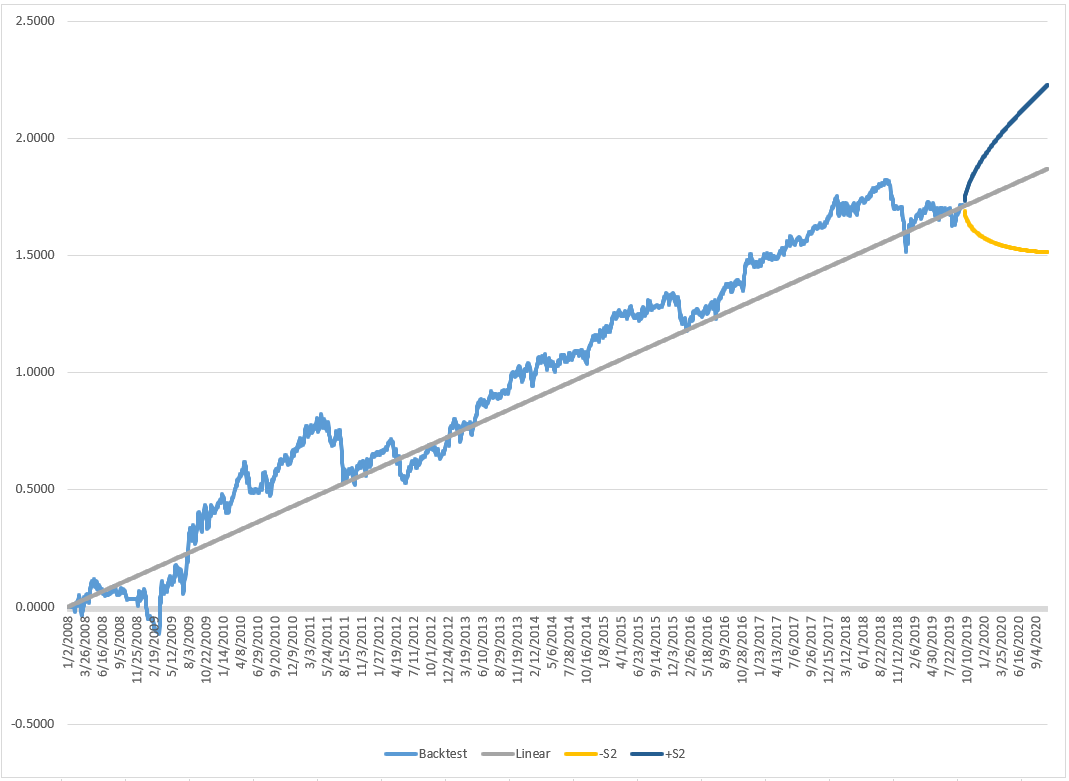
If the strategy continues to behave in the future as it did in the past, then we would expect that 95% of the time it will stay between the two curves. Falling below this bottom curve would be a signal that the strategy is not performing as expected and you should consider taking the strategy offline.
Real Trading
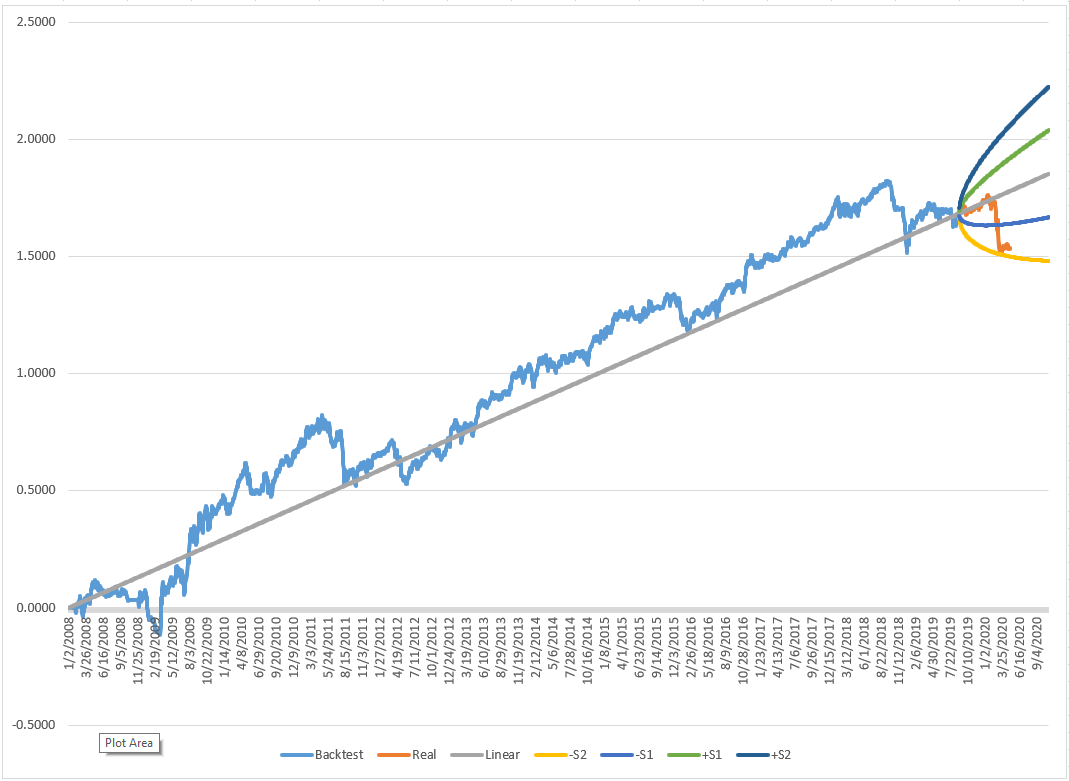
In the chart below, the orange part of the curve is the real-time return of the strategy. As you can see, the strategy has been bouncing above and below the bottom curve. This would be a signal to potentially take the strategy offline. I have also added the 1 standard deviation cones.
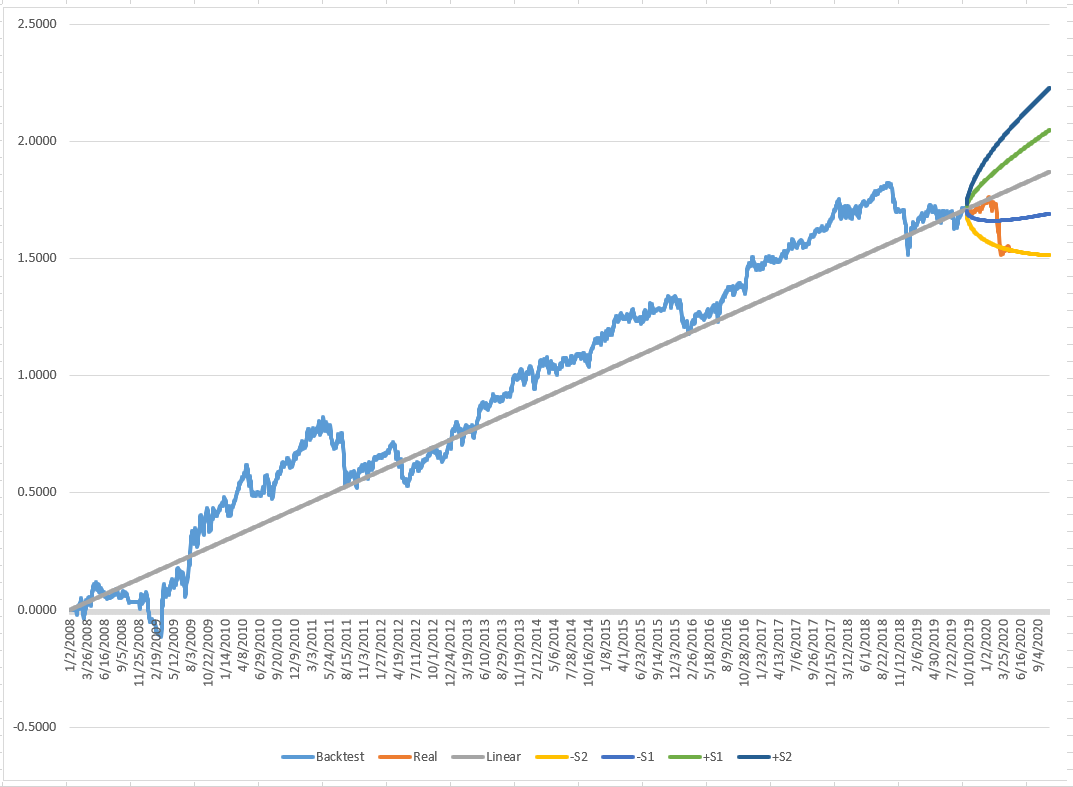
Would I take it offline at this point? I like looking at the general market too before deciding. Given that the entire market was being hammered at this point, I would not likely have taken it offline.
Starting Point
One important decision with the cones is where to start our calculations. From the start of our backtest? The last three years? The last year? Davey suggests using the entire backtest period. I would lean more to the last 3 to 5 years. Markets change over time and a shorter lookback period is more likely to catch this.
Here is chart using the last three years.
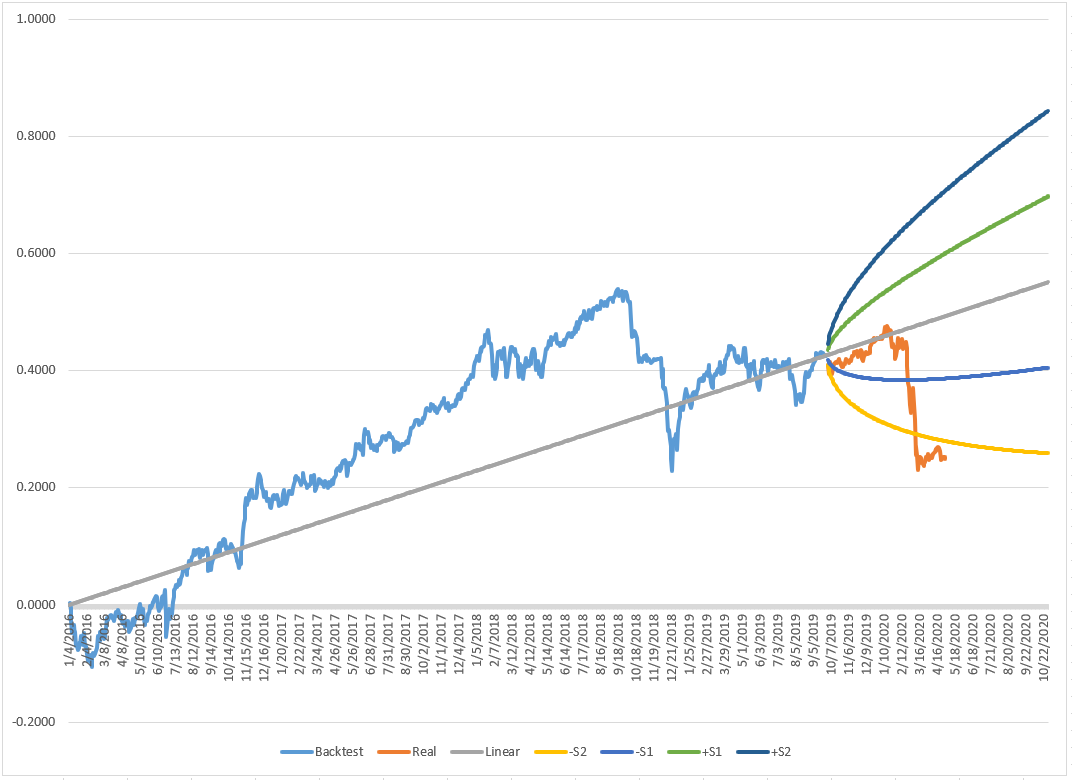
It is good to see that it also hits the 2SD cone. Here it is more definitive.
Ending Point
What if you started trading this strategy a month earlier? Notice the difference in the equity curve location.
Now the equity curve just stays above the 2SD cone.
Updating the Data
How often should you recalculate the average return and standard deviation? Davey recommends, you keep the cones as is and never update them. That does not feel right for my gut. But I am not sure what is the right period. Every quarter? Seems to frequent. Every year? That feels about right. This is what I see is one of the most influential decisions when using the cones.
Here is what it looks like if you had updated the cones on 1/1/2020.
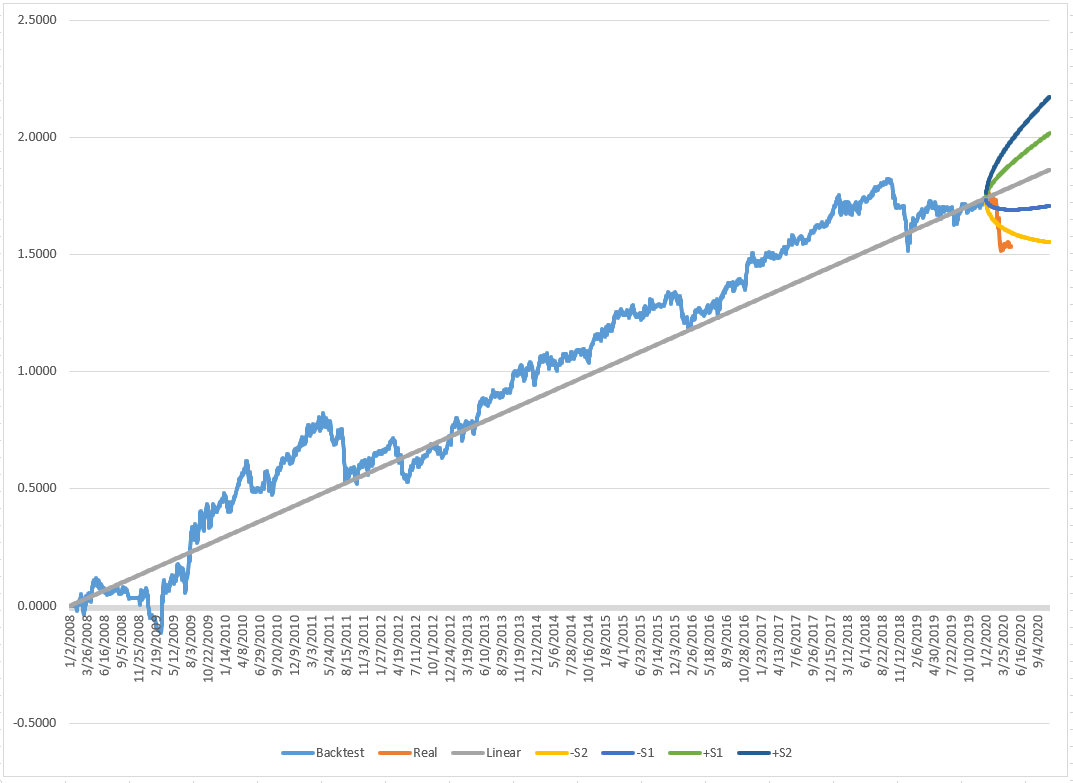
Now the bottom 2SD cone is clearly violated.
Spreadsheet
Fill in the form below to get the spreadsheet used to generate the charts above. It is a very sophisticated spreadsheet with very little documentation.
Presentation
For members of The Crew, I will be doing a Zoom presentation on December 16th covering this post and how to use the spreadsheet. Sign up for a free trial before then, and you can watch the presentation either live or recorded.
Final Thoughts
Conceptually I like probability cones. The concept has a lot of variables that need to be considered. How much data do you use? What do you use as the endpoint? What value do you use for the cone size? How should the cone be violated to stop trading? Do you update the cones? If so, how frequently?
The biggest issue I have with the cones is the assumption that future results will match backtested results. I wish that was true. But I have some ideas on how to mitigate this.
These are important parameters that can have a huge impact on when you stop trading. There are more sophisticated ways of creating the cones that help remove some of the parameters.
I will be likely be adding this as a secondary measure to determine if a strategy should be taken offline. I recommend you look closely at them.
Backtesting platform used: AmiBroker. Data provider: Norgate Data (referral link)
Good quant trading,

Fill in for free spreadsheet:

