
- in Mean Reversion , Research , Stocks by Cesar Alvarez
Volume and Mean Reversion
Overall, I have had very little success integrating volume into any of my strategies. Either volume would have no predictive value or if it did, using it reduced the number of trades too much to be worthwhile. It has been a long while since I have looked into this and I had some new ideas.
The Rules
Test date range 1/1/2007 to 10/31/2022. I wanted to keep the rules simple.
Buy Rules
- Stock is a member of the Russell 3000
- 2-period RSI is less than 1
- Close is greater than $3
- 21-day moving average of Close*Volume is greater than $1 million
- [Stock is above 200-day moving average, Stock is below 200-day moving average,]
- Enter on next open
Sell
- 2-period RSI is greater than 70
- Exit on the next open
I am looking at all trades, this is not a portfolio. On the setup day, I calculate the Percent Rank of the volume from the last 20 days. From AmiBroker help, “Returns percent rank (0…100) of the current element of the array within all elements over the specified range.” Previously I had looked at the current volume divided by the average (or median) of the last 20 days with little success.
The AmiBroker code for this is “PercentRank(V, 20)”
Results Above the 200-Day Moving Average
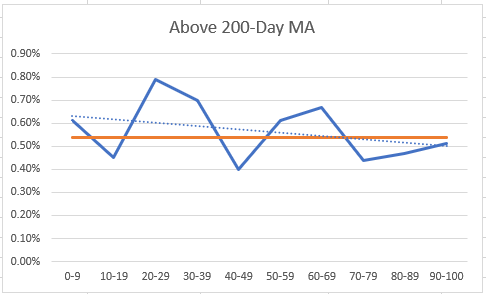
The blue line is the avg % p/l for each PercentRank bucket. The dotted line is the trendline. The orange line is the average % p/l for all trades, .54%. The lower volume trades in general are above average. The average of trades in PercentRank from 0 to 39 is .64%, which is 18% above the average. But now we run into the issue of the number of trades.
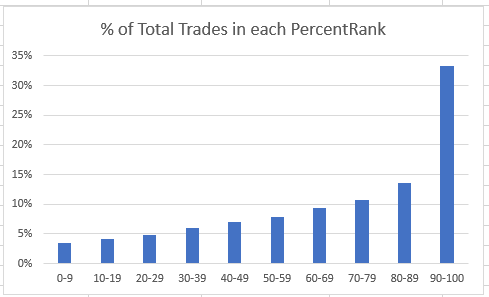
We can see that 33% of the trades happen with the highest volume of the last 20 days. Looking at PercentRank 0-39, that is only 18% of trades. So, to get the bump in average % p/l, we lose 82% of the trades.
Results Below 200-Day Moving Average
Because I trade my mean reversion strategy both above and below the 200-day moving average, I was curious about these results.
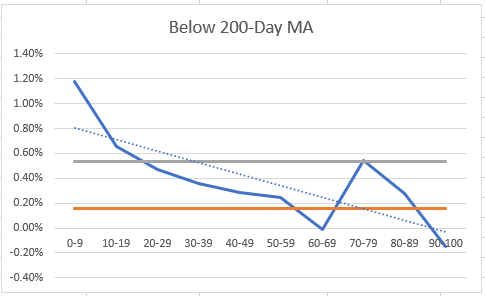
I have added another line to the chart, the grey line which represents the average %p/l for trades above the 200-day moving average. Two things jump out at me, there is a definite trend of lower volume setups doing better. But the avg. %p/l of .15% for the trades below the 200-day MA is substantially below when above the MA. This is interesting because in my own mean reversion strategy, it is the reverse. Though trades with PercentRank between 0-20 still outperform the above 200-day average.
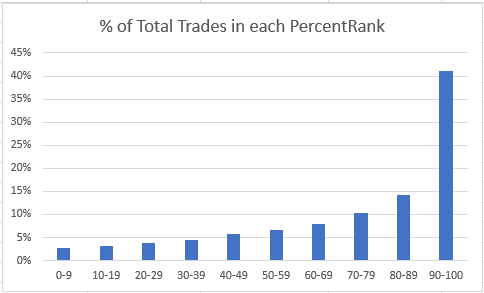
We see the same pattern in the number of trades.
Adding Finding to a Portfolio
I have a mean reversion strategy I trade that I want to add these results to. To my set-up rules, I will add PercentRank(Volume, 20) < 20 as another filter.
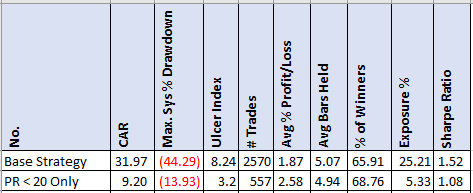
As expected, the exposure dropped dramatically from 25% to 5%. The avg. % p/l takes a large jump from 1.87% to 2.58% with % winners increasing slightly.
Instead of adding PercentRank as a filter, what happens if we rank signals with a PercentRank < 20, higher than those without? This should give us about the same number of trades.
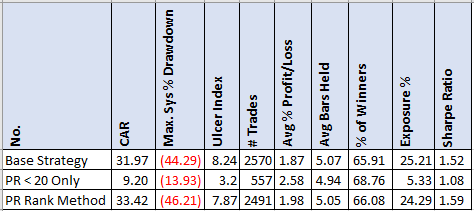
We see a small improvement in CAR, UI, avg %p/l, % winners and Sharpe Ratio.
Final Thoughts
We did find volume providing an increase in the edge. Surprisingly it is a low volume that gives the edge. Though the problem is it is only a small fraction of the setups. Adding PercentRank < 20 as a preference for ranking the signals had a small improvement in most of the important statistics. But not a big one.
Is it worth adding this to my strategy? No. The reason is that we are adding more rules with only a small benefit. I like to see a larger improvement in the numbers when adding complexity.
But if you are a discretionary quant trader, like my good trading buddy, then this is useful information. One can prioritize trades and adjust position sizing when getting these low volume situations.
A post using a reader’s suggestion: Volume and Mean Reversion Part 2
Backtesting platform used: AmiBroker. Data provider: Norgate Data (referral link)
Good quant trading,

