
- in Breakouts , Research , Stocks by Cesar Alvarez
Volume Positive Negative Indicator for Breakouts
Probably like a lot of you, I am an indicator junkie. Whenever I read about an indicator I have not tested and makes some sense, I got to try it out. Now, most of the time they turn out to not be useful for my strategies.
While reading the April 2021 Technical Analysis of Stocks & Commodities, I came across an article about Volume Positive Negative (VPN) Indicator for detecting high-volume breakouts. As I have written before, I rarely use volume in my strategies because I can never get it to work. Here was an indicator using volume, not a chance I would not test this.
Volume Positive Negative (VPN) Indicator Calculation
From the article “this indicator compares the difference between the volume on up days (positive) and the column on down days (negative) with the total volumes as follows: The sum of the negative volume is subtracted from the sum of the positive volume over a specific period. Is subtracted then normalized by dividing by the period and multiplying by 100.”
One thing I like about this indicator is that is bound between -100 and 100. It seems conceptually very simple. But when I got into the details it got a little more complicated. Moves are measured to be positive or negative only if over 10% of the ATR. Below is the AmiBroker code
VPN AmiBroker Code
function VolPosNeg(per)
{
smoLen = 3;
mav = MA(V,per);
avgprice = (H+L+C)/3;
MF = avgprice - Ref(avgprice, -1);
MC = .1*ATR(per);
VMP = Iif(MF > MC, V, 0);
VP = Sum(VMP, per);
VMN = IIf(MF < -MC, V, 0);
VN = Sum(VMN, Per);
VPN = 100*((VP-VN)/MAV/Per);
VPN = EMA(VPN, smoLen);
return VPN;
}
First, we need a strategy to try VPN on. This is a very simple idea. Test range 1/1/2007 to 12/31/2020.
Buy Rules
- Stock is a member of the Russell 3000 index
- Price is greater than $5
- The 20-day moving average of close times column is greater than $1,000,000
- The $SPX is above its 200-day moving average
- The close is at a 260 day high of closes
- It has been over 15 trading days since last 260 day high of closes
- Buy on next open
Sell Rules
- If on the close stock has a 15% or more loss
- If on the close stock has a 25% or more gain
- Have been in position for 60 trading days
- Exit on next open
When evaluating an indicator, I normally do not test a portfolio. Instead, I buy equal dollar amounts because the stats I care most about are average %p/l and % correct and I want to get all possible trades.
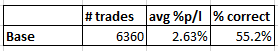
Here are the results of this basic strategy.
Buckets
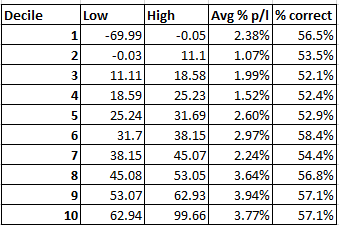
Now for those 6360 trades, I determine that VPN(30) on the day of setup. I use a length of 30 because the article suggested that. Then I determine the VPN values needed to create 10 equal number of trade buckets. For each bucket, I calculate the avg % p/l and % correct
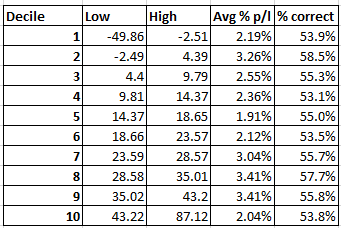
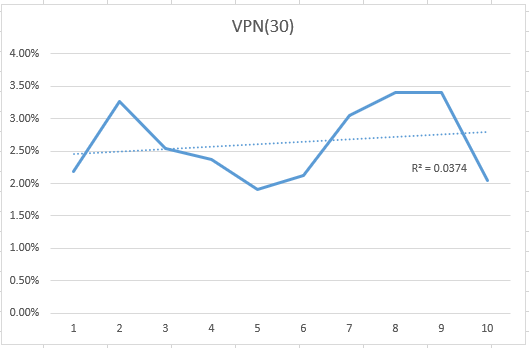
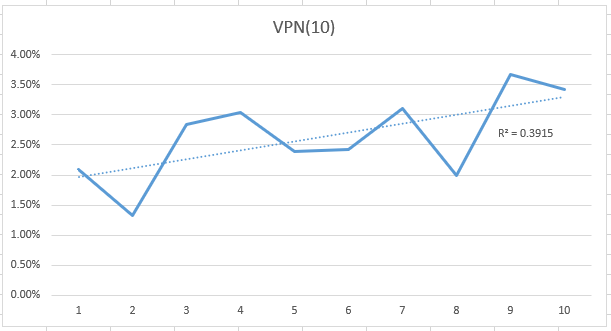
The Low and High columns are the VPN values for that bucket. There seems to be a slight slope up in the avg % p/l. Plotting the values does show a very small slope up but the r-squared value is only .04. In the perfect world, this would be a nice up-sloping line from bottom left to top right.
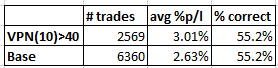
Looking at the table, trades with VPN greater than 25 looks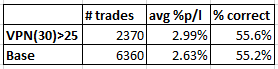 like they may do better. Looking at those trades we get the following.
A 13% improvement in avg %p/l. Not much.
What next? For me, it is trying different parameter lengths. Typically, I try smaller first. Trying VPN(20) improved the results (see spreadsheet) and so did VPN(10).
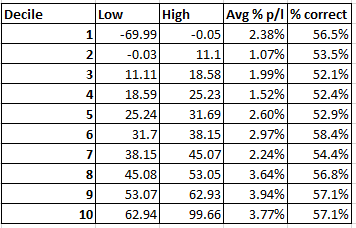
VPN(10) Results
The linear regression line is sloping up more and the r-squar3ed is .39. Better results.
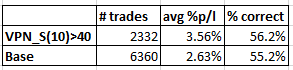
The VPN cutoff now looks better at 40.
Even though avg % p/l and % correct, are about the same as VPN(30), it does seem that VPN(10) is better because of the r-squared value.
Changing VPN calculation
One thing I always try and do is simplify. In this case, I got to thinking about the VPN calculation and how it could be simplified. Instead of using average price, use the Close. Instead of using ATR to determine if move big enough, use zero. The changed code is in red.
VPN_S AmiBroker Code
function VolPosNeg_S(per)
{
smoLen = 3;
mav = MA(V,per);
avgprice = Close;
MF = avgprice - Ref(avgprice, -1);
MC = 0;
VMP = Iif(MF > MC, V, 0);
VP = Sum(VMP, per);
VMN = IIf(MF < -MC, V, 0);
VN = Sum(VMN, Per);
VPN = 100*((VP-VN)/MAV/Per);
VPN = EMA(VPN, smoLen);
return VPN;
}
VPN_S(10) Results
Here are the results of my simplified version.
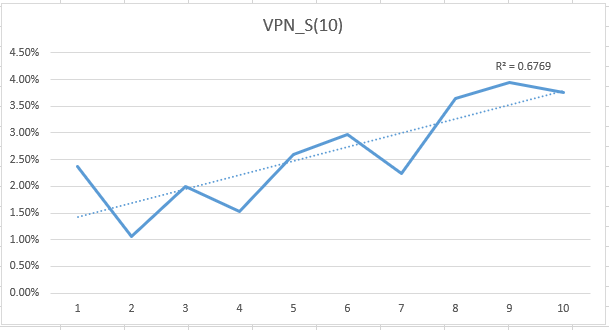
These results look much better. A nice-looking up slope with a r-squared of .68.
We now have a 35% increase in avg % p/l. Now that is something good.
Spreadsheet
Fill in the form below to get the spreadsheet with lots of additional information. I show results of VPN lengths of 5, 10, 20, 30, 40, 60. For VPN_S, there are 5, 10, 20, 30. This spreadsheet is a little bit rawer than most of my spreadsheets.
Final Thoughts
It is rare that an indicator actually shows potential. The original VPN had small potential but not enough to excite me enough to try on my own breakout strategies. But by simplifying the indicator slightly, the results improved enough that now I will try it on my breakout strategies.
Will doing so help? Maybe. I find that sometimes an indicator will work well in isolation like here but when applied to an existing strategy it does not. This is because the strategy may be already capturing a lot of what is in the indicator. But since I do not use volume in my breakout strategy, I have higher hope for this one.
Try it on your breakout strategies.
Backtesting platform used: AmiBroker. Data provider: Norgate Data (referral link)
Good quant trading,

Fill in for free spreadsheet:

