Market Barometer
Click here to see the strategies I am currently trading with my money.
7/15/2026
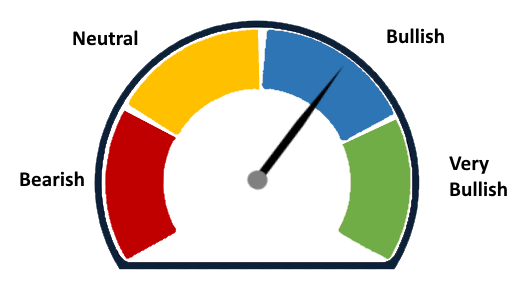
Where is the Market currently?
 |
|
| One Week Ago |
One Month Ago |
Last signal change on June 1, 2026
Current Year
Scroll down to see previous years.

The Market Barometer
Several different S&P500 Index price-based models are used as input along with bonds and other markets related to the stock market. These are combined to give a rating.
The Market Barometer is predicting more long-term behavior in the market.
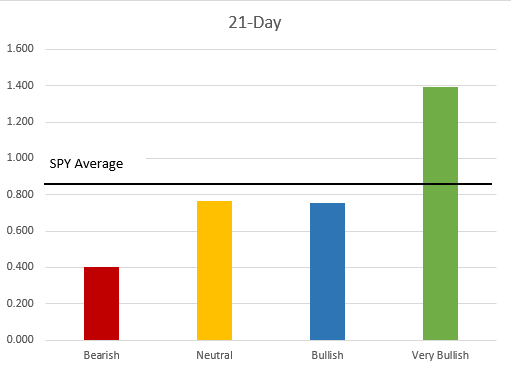
Statistics on each rating
Statistics are based on data from 1/1/2004 to 12/31/2021.
21-Day return
The black line is the average 21-day return of the SPY which is 0.93%. Each bar is the average 21-day return of the rating.
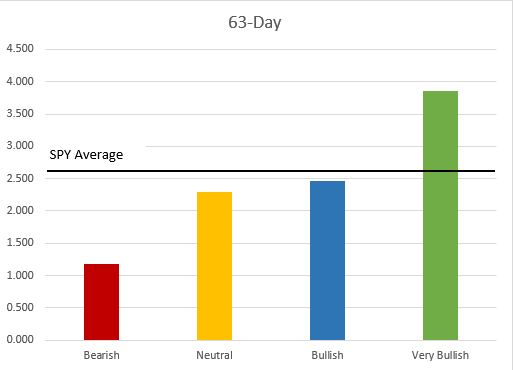
63-Day return
The black line is the average 63-day return of the SPY which is 2.77%. Each bar is the average 63-day return of the rating.
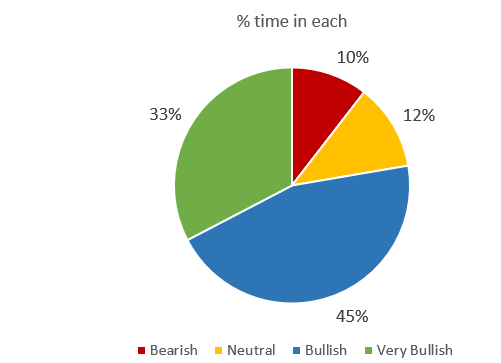
Percent Time
The percentage of time spent in each rating.
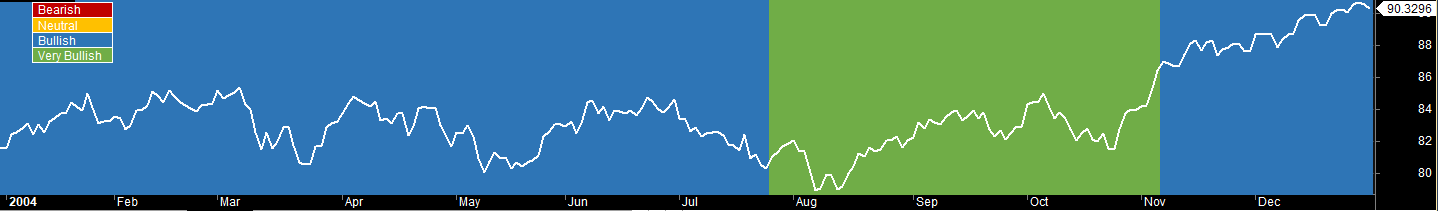
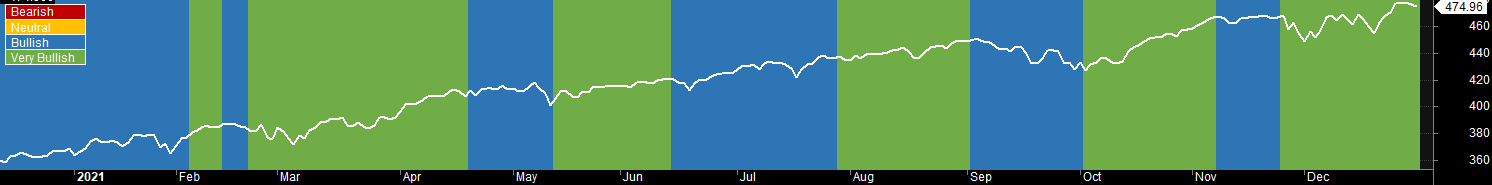
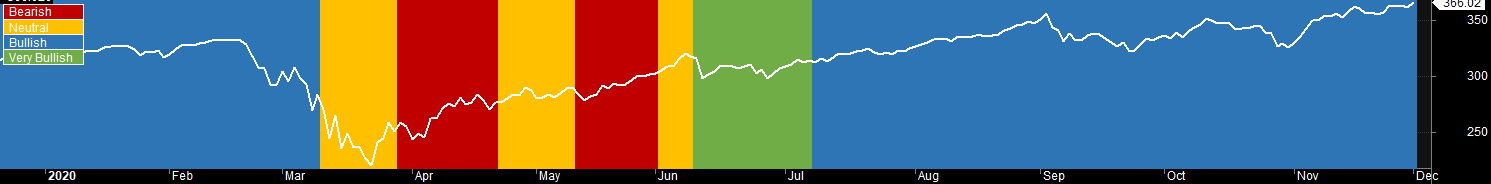
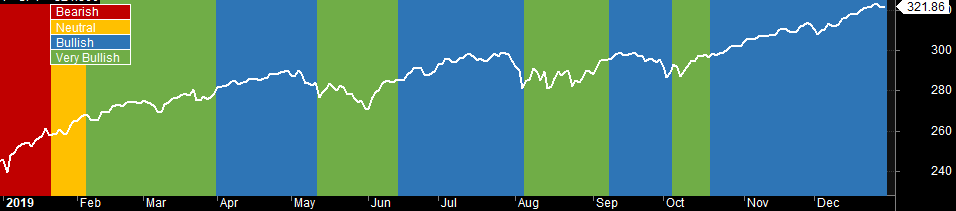
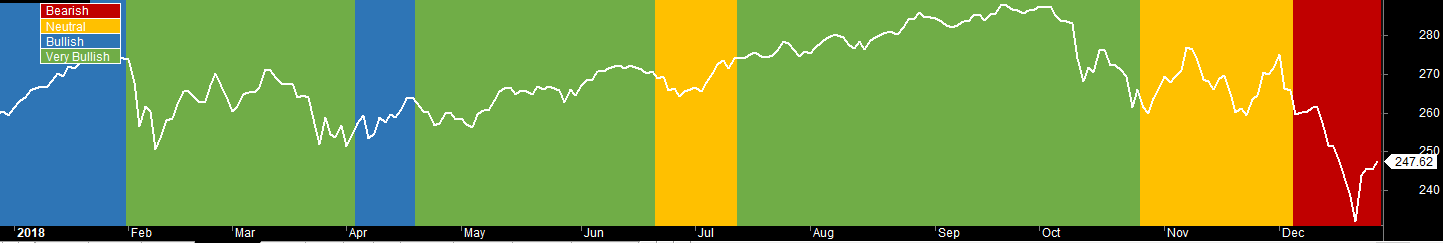
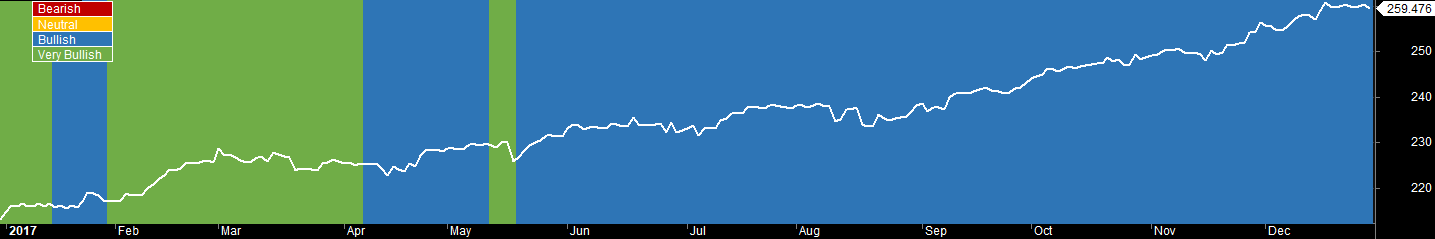
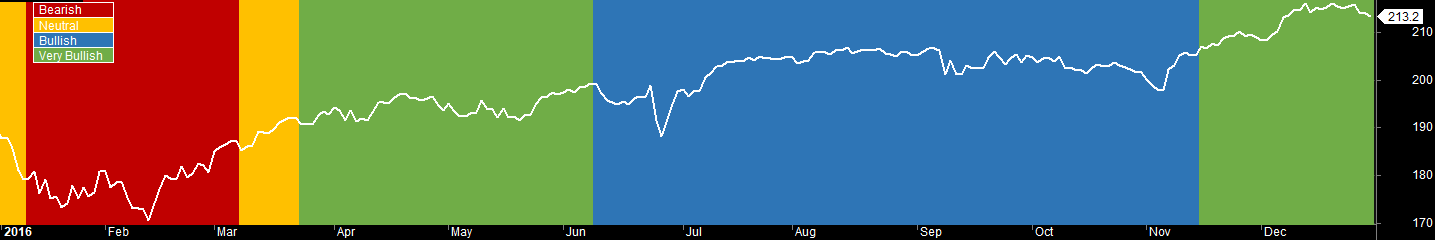
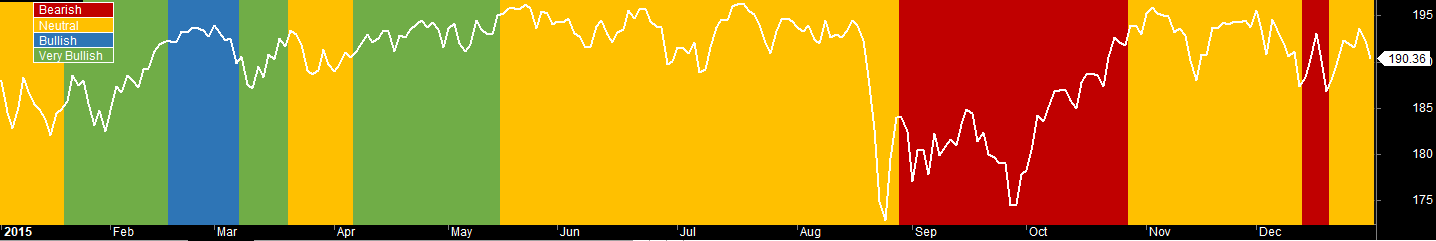
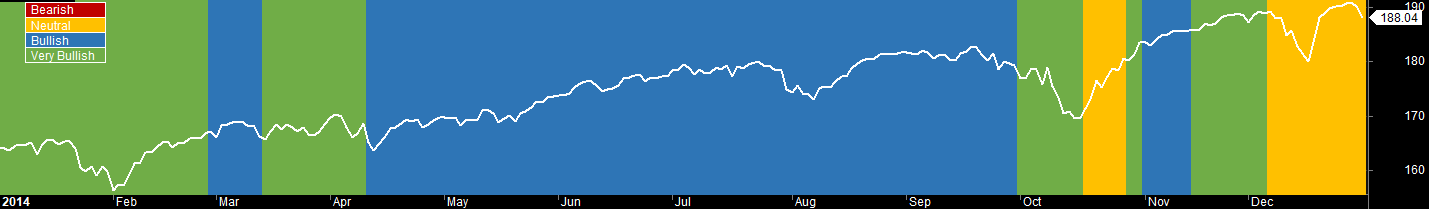
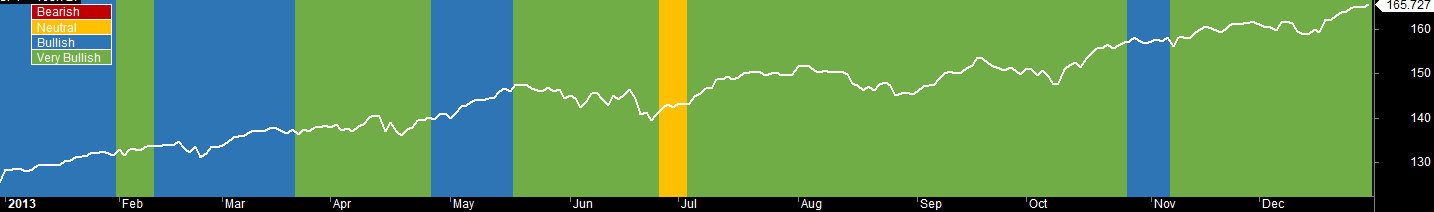
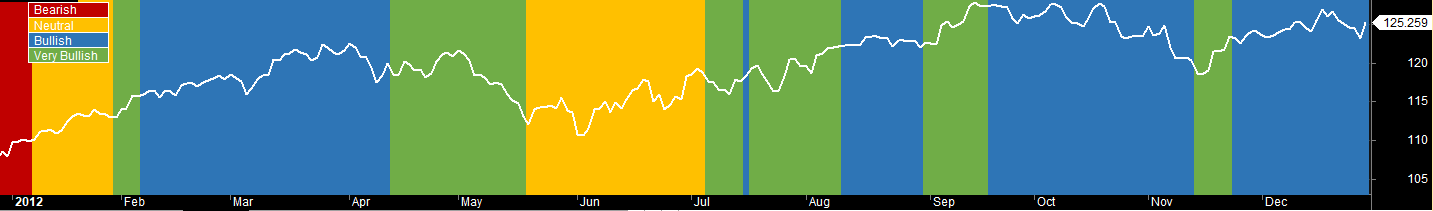
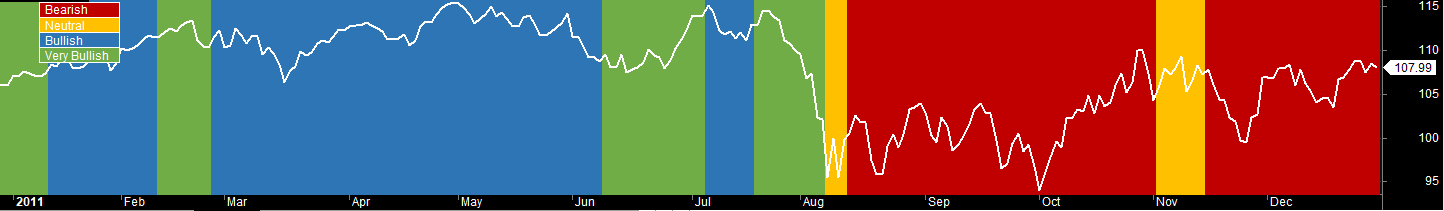
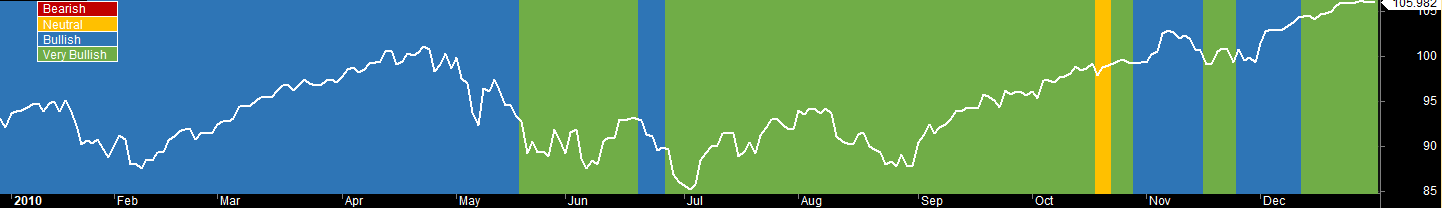
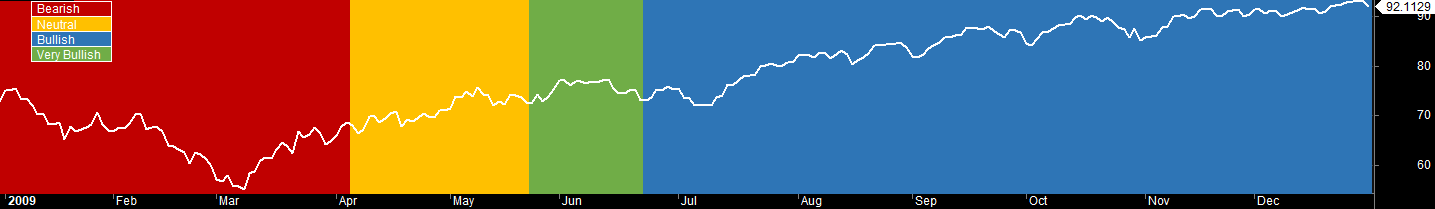
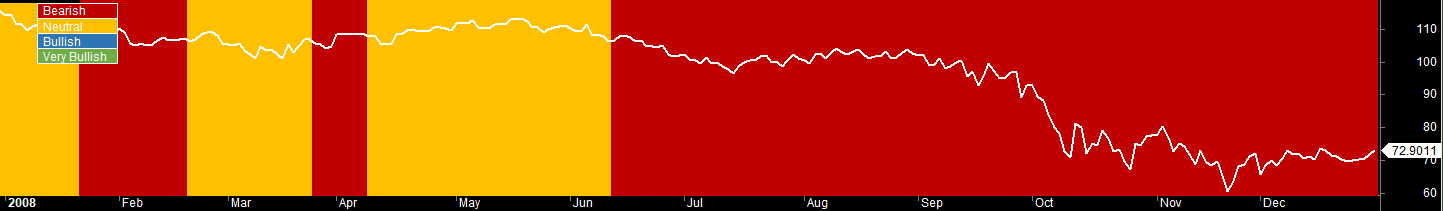
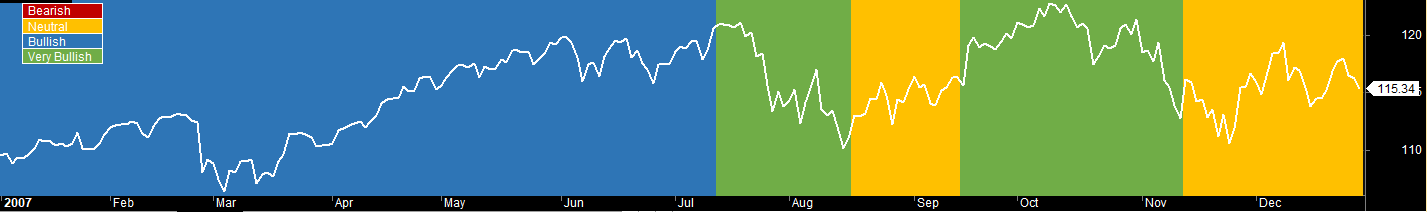
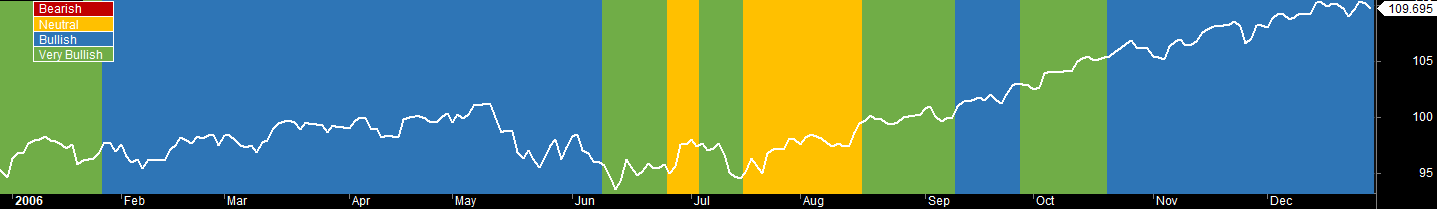
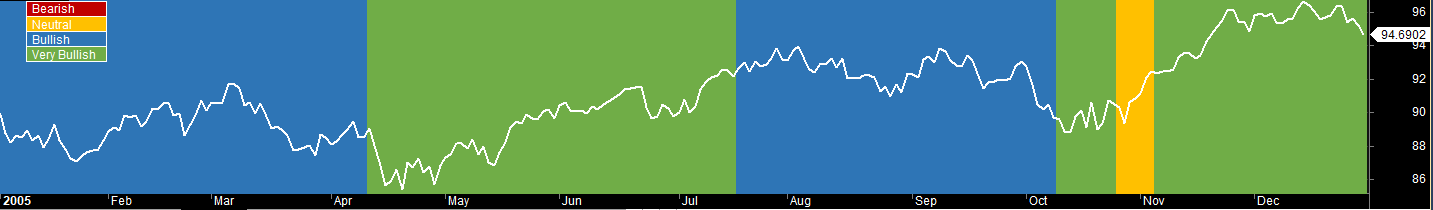
Yearly Charts
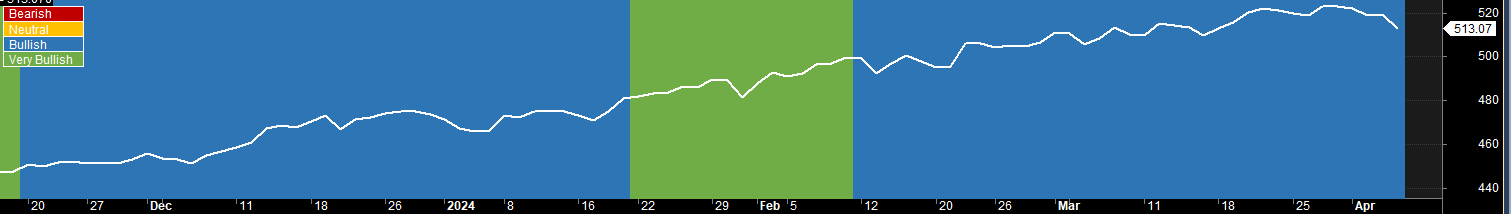
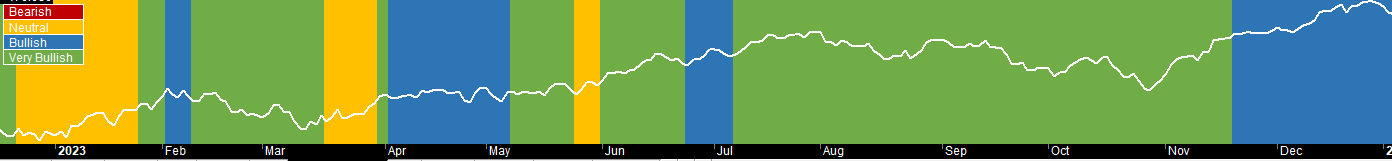
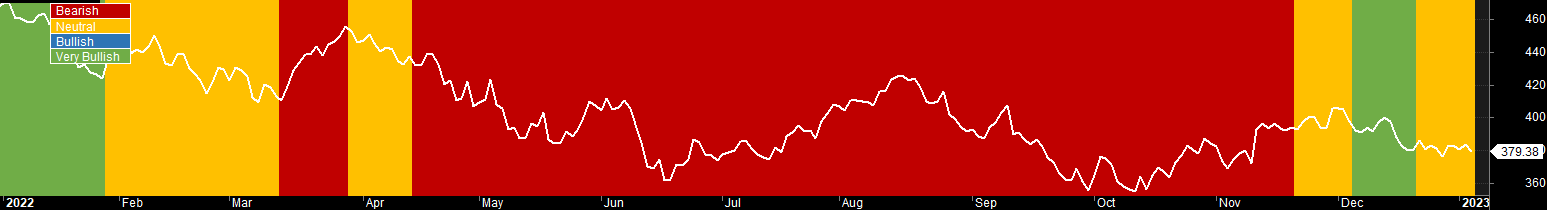
The color band indicates the state of the Market Barometer. The white line is the SPY, adjusted for dividends.
2025

2024
2023
2022
2021
2020
2019
2018
2017
2016
2015
2014
2013
2012
2011
2010
2009
2008
2007
2006
2005
2004