
AmiBroker Sample Code
AmiBroker code for various statistics and indicators. If you have any ideas of other code snippets to add, send them to me. Use my contact form.
Multiple Strategies Backtest and Optimization Tool
Do you trade multiple strategies? See how you can create equity curves for each of your strategies and then combine them to see how they perform together. Learn more about my Multiple Strategies Backtest and Optimization Tool.
ConnorsRSI
For the ConnorsRSI Guidebook, click here
File: Click to download: ConnorsRSIa.afl
// Provided by Cesar Alvarez www.AlvarezQuantTrading.com// ConnorsRSI from http://analytics.tradingmarkets.com/ConnorsRSI/paramLenRSI = Param("RSI Closes Length", 3, 2, 100, 1);paramLenUD = Param("RSI UpClose Length", 2, 2, 100, 1);paramLenRank = Param("PerecentRank Length", 100, 10, 200, 1);function ConnorsRSIa(arr, lenRSI, lenUD, lenROC){ upDays = BarsSince(arr <= Ref(arr,-1)); downDays = BarsSince(arr >= Ref(arr,-1)); updownDays = IIf(upDays > 0, upDays, IIf(downDays > 0, -downDays, 0)); crsiT = ( PercentRank(ROC(arr,1), lenROC) + RSIa(updownDays,lenUD) + RSIa(arr, lenRSI))/3; return crsiT;}function ConnorsRSI(lenRSI, lenUD, lenROC){ upDays = BarsSince(C <= Ref(C,-1)); downDays = BarsSince(C >= Ref(C,-1)); updownDays = IIf(upDays > 0, upDays, IIf(downDays > 0, -downDays, 0)); crsiT = ( PercentRank(ROC(C,1), lenROC) + RSIa(updownDays,lenUD) + RSI(lenRSI))/3; return crsiT;}crsi = ConnorsRSI(3,2,100);Plot( ConnorsRSIa(C, paramLenRSI,paramLenUD,paramLenRank) , "ConnorsRSI("+paramLenRSI+","+paramLenUD+","+paramLenRank+")" , ParamColor( "Color", colorBlue ), ParamStyle("Style", styleLine), 0, 100); |
ReverseRSI/RSI Solver
Want to know what closing value a stock needs to close at to reach a certain RSI value? This AFL code will do that for you.. A very handy tool if you like to enter at the close.
File: Click to download: ReverseRSI.afl
/////////////////// Reverse RSI Calculator ////////////////////////// Determines the closing value of a stock need to reach a particular RSI valuefunction ReverseRSI(nLen, rsiTarget){ gain = Max(C-Ref(C,-1), 0); loss = -Min(C-Ref(C,-1), 0); rsGain = IIf(BarIndex() < nLen-1,Null, IIf(BarIndex()==nLen-1, MA(gain, nLen), gain)); rsLoss = IIf(BarIndex() < nLen-1,Null, IIf(BarIndex()==nLen-1, MA(Loss,nLen), Loss)); rsGain = AMA(rsGain, 1/nLen); rsLoss = AMA(rsLoss, 1/nLen); RSIcalc = IIf(BarIndex()<nLen-1, Null, 100*rsGain/(rsGain+rsLoss)); targetPrice = IIf( (rsiTarget < RSI(nLen)), C-100*(((nLen-1)*rsGain)/rsiTarget)+((nLen-1)*rsGain)+((nLen-1)*rsLoss), C+((rsiTarget/(100-rsiTarget)*((nLen-1)*rsLoss))-((nLen-1)*rsGain)) ); return targetPrice;} Filter = TRUE ;AddColumn(C,"Close");AddColumn(RSI(2), "RSI2");AddColumn(ReverseRSI(2, 30),"RSI30-Next Day Price",1.3);AddColumn(ReverseRSI(2, 70),"RSI70-Next Day Price",1.3); |
Historical Volatility
File: Click to download: HistoricalVolatility.afl
How to Calculate Historical Volatility in Excel
// Provided by Cesar Alvarez www.AlvarezQuantTrading.com// Historical Volatility lenPeriod = Param("Periods",100,10,1000,1);HV = 100 * StDev(log(C/Ref(C,-1)),lenPeriod) * sqrt(252);Plot(HV, "HV("+lenPeriod+")", ParamColor( "Color", colorRed ), ParamStyle("Style") ); |
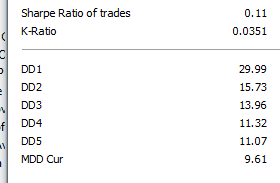
Worst 5 Drawdowns
Get a list of the 5 worst drawdowns and the current drawdown in the Back Test Report.
Click to download: WorstDrawdowns.afl
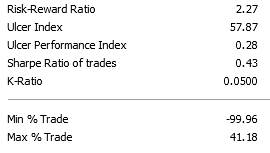
Min/Max Trade
For the worst and best trade on a percentage basis in the Back Test Report, use the code below. Enter email below to get access.
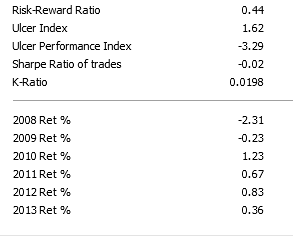
Yearly Returns
For a breakdown of the yearly returns in the Back Test Report, use the code below. Enter email below to get access.
PREMIUM CONTENT LOCKED
Enter Your Details For Instant Access
Get instant access to code and downloadable AFL file
File: Click to download: WorstBestTrade.afl
// Provided by Cesar Alvarez www.AlvarezQuantTrading.com////////////////////////////////////////////////////////////// Replace with your codeSetOption("MaxOpenPositions",10);SetPositionSize(10,spsPercentOfEquity);Buy = RSI(2) < 1;Sell = RSI(2) > 80;Short = Cover = 0;// End of replace///////////////////////////////////////////////////////////// Or you can add the following to the end of your current codeSetCustomBacktestProc("");if(Status("action") == actionPortfolio){ bo = GetBacktesterObject(); bo.backtest(); minTrade = maxTrade = 0; for( trade = bo.GetFirstTrade(); trade; trade = bo.GetNextTrade() ) { maxTrade = Max(maxTrade, trade.GetPercentProfit()); minTrade = Min(minTrade, trade.GetPercentProfit()); } for( trade = bo.GetFirstOpenPos(); trade; trade = bo.GetNextOpenPos() ) { maxTrade = Max(maxTrade, trade.GetPercentProfit()); minTrade = Min(minTrade, trade.GetPercentProfit()); } bo.AddCustomMetric("Min % Trade", minTrade); bo.AddCustomMetric("Max % Trade", maxTrade);} |
File: Click to download: YearlyReturns.afl
// Provided by Cesar Alvarez www.AlvarezQuantTrading.com// this code is for daily bar tests////////////////////////////////////////////////////////////// Repalce with your codeSetOption("MaxOpenPositions",10);SetPositionSize(10,spsPercentOfEquity);Buy = RSI(2) < 5;Sell = RSI(2) > 80;Short = Cover = 0;// End of replace///////////////////////////////////////////////////////////// Or you can add the following to the end of your current code// will not output anything if there are less than 200 bars in your testSetCustomBacktestProc("");if(Status("action") == actionPortfolio){ dnStart = Status("rangefromdate"); dnEnd = Status("rangetodate"); yrStart = int(dnStart/10000); yrEnd = int(dnEnd/10000); bo = GetBacktesterObject(); bo.backtest(); ver = Version(); if(BarCount > 200) { dt = DateNum(); if(ver <= 5.4) eq = Foreign("~~~EQUITY", "C"); else eq = bo.EquityArray(); // This could also be done by compressing to Monthly bars eqM = 0; // end of year equity - saving 2001 data in bar 101, 2002 in bar 102, ... for (i = 1; i < BarCount-1; i++) { // are we at the end of a year if (int(dt[i+1]/10000) > int(dt[i]/10000) ) eqM[int(dt[i]/10000)] = eq[i]; } // save the last equity eqM[yrStart-1] = GetOption("InitialEquity"); eqM[yrEnd] = eq[BarCount-1]; // output the results for (i=yrStart; i<= yrEnd; i++) { bo.AddcustomMetric("" + (i + 1900) + " Ret % ", 100*(eqM[i]/eqM[i-1] - 1)); } }} |