
- in Research by Cesar Alvarez
The 100% Club. 2000 Tech vs 2026 AI
Are the markets like they were in March 2000, right at the top of tech-bubble? I have been seeing lots of facts about how expensive or extended this market is. The Schiller P/E ratio near the 2000 top. The Buffett Indicator at over 2 standard deviations, similar to the 2000 top. US Total Stock Market Value/GDP at all-time highs, far exceeding the 2000 top. The weight of the top 10 stocks in the S&P 500 above the 2000 top. $SOX index up 38% in April vs 50% in February 2000. On and on.
These all have me concerned. I traded during the Tech Bubble. Are we in a bubble? Probably. When will it burst? I don’t know.
Then I got curious how is the pure price action compared to then? At the Tech Market top, what percentage of Nasdaq 100 stocks had gone up more the 100% over the last year? How does that compare to now?
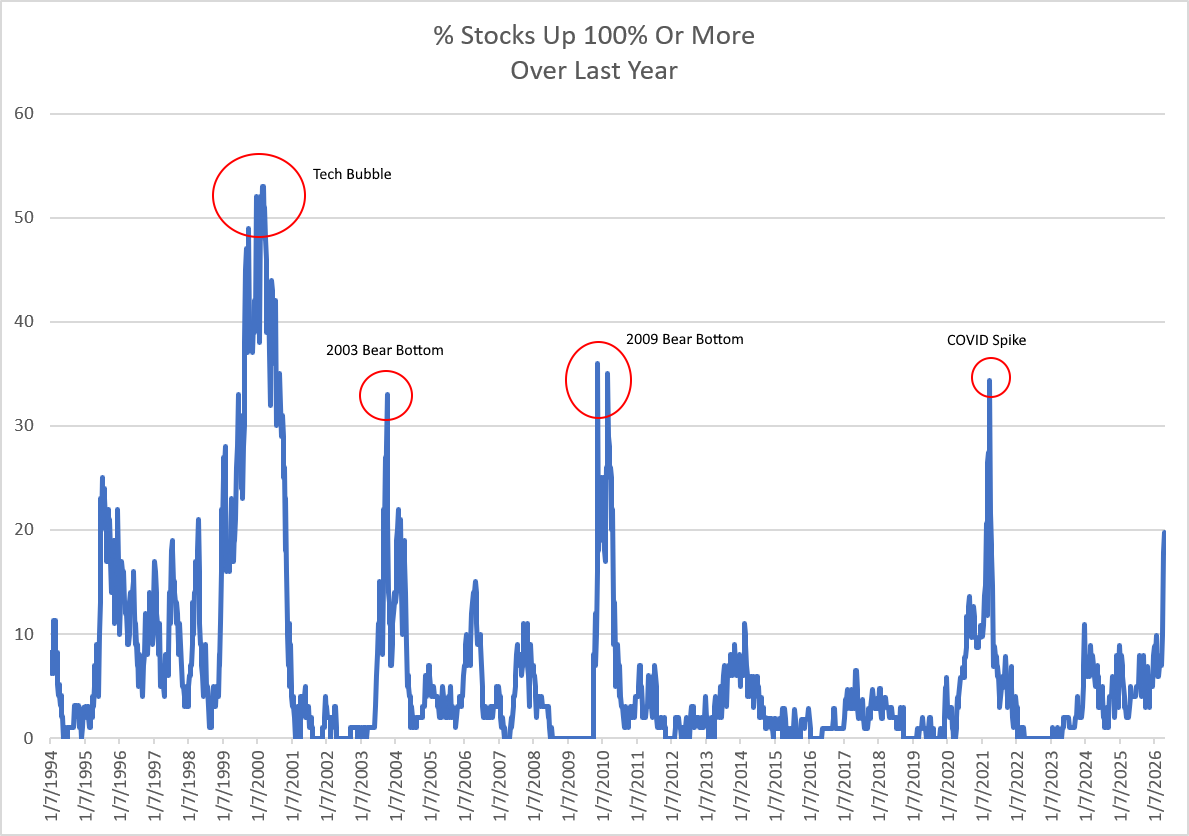
First thing that jumps out to me is the Tech Bubble, with 53% of the stocks doubling over the last year. WOW! I remember it being crazy, but not that crazy. Most of the time, when we cross over 30%, it is after a market bottom. We are sitting at 20%, which is significantly below the Tech Bubble. This is a tiny sample size. From a price action point of view, things can get a lot crazier.
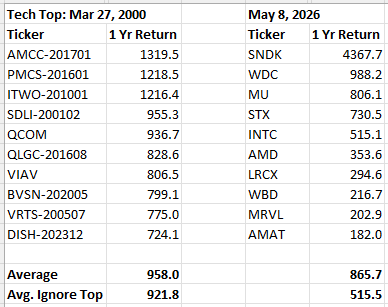
Next, I wanted to compare the top 10 stocks over the last year. Maybe we have more concentrated craziness now?
Looking at the average one-year return of the top 10 stocks, the current market is close to the Tech Bubble. But SNDK is a huge outlier. Removing that and taking the average of positions 2 to 10, we see that the current market is not close.
The market may be over-valued by various metrics. Highly concentrated in a few stocks. But comparing the price action from the Tech Bubble to today. We still have a lot more room to the upside. $SPX 10,000?
Backtesting platform used: AmiBroker. Data provider: Norgate Data (referral link)
Good quant trading,
