- in Data , ETFs by Cesar Alvarez
Is synthetic XIV/VXX data safe to use?
I have done several posts about trading XIV & VXX. In these posts (here, here and here) I refer to using synthetic data before these ETFs started trading. I supported the use of the data due to the very high correlation of daily returns during the overlap period. With a correlation of .97, I thought great the data should be good to use for backtesting.
Then the head slapping moment. Run the strategy during overlap period using both the real data and the synthetic data. If the synthetic data was good substitute, I would expect only a small change in the results.
Overlap Period
The overlap period where I have real VXX & XIV data and synthetic data is from 12/1/2010 to 12/12/2014. Four years should generate enough trades to see how running a strategy on each compares. A downside of synthetic data is that we only have closing prices. Because of this, the strategies will be tested entering/exiting on the close of the signal day with the rules only using the closing price.
First Strategy
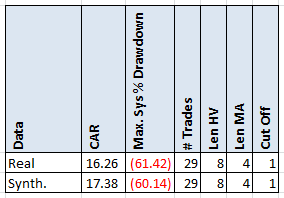
The first strategy tested is the one from VXX & XIV Strategies. See that post for the rules. An interesting point is that the strategy uses the SPY and VIX to trigger signals. Using the values that I focused on the earlier post, we get the following.
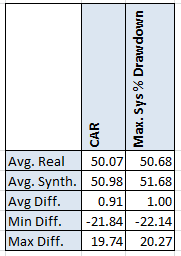
This is a good sign. The CAR and MDD are very close to each other. But there are not too many trades. Using the optimization results from the earlier post, I filtered the spreadsheet to only focus on variations with more than 50 trades and have a CAR greater than 20. This gives 155 variations which to compare.
Comparing the CAR and MDD we can see that on average difference is very small. This is great to see and gives me confidence that using the synthetic data in this case is OK. But remember we are using the SPY & VIX to trigger trades. What if we are using the VXX & XIV to trigger trades?
Just another Volatility SPY strategy
Someone sent me a link to this strategy. I am always looking for something new test and figured this would also be good to use. I was able to closely replicate the results. Next, I did an optimization around the parameters that they have to see if they were stable and if there are better ones to pick. What I discovered is that the parameters used were the best ones from my optimization. I never like trading the best ones.
Original Rules
- WVF = Using VXX, 100 * (the highest Close in the last 28 days minus today’s Low) divided by the Highest Close in the last 28 Days
- Buy XIV when WVF crosses above 14. Exit VXX.
- Buy VXX when WVF crosses below 14. Exit XIV.
The original method invests different amounts in XIV (30%) and VXX (10%) when they signal. To make the strategy work for this test, I changed the rules slightly. In the calculation of WVF they use the low of VXX. Instead I used the close. Invest 100% in either ETF.
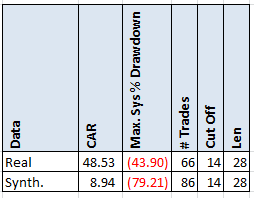
These are the results of the strategy with my changes
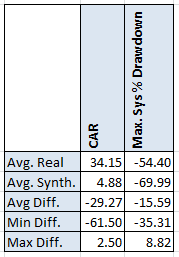
Now if that does not make you take a double take, nothing will. These results are not even close to each other. The CAR drops 40 points and the drawdown gets 36 points worse. Even the number of trades changes dramatically. Using the synthetic data to signal is not something I would use. Maybe it is just this variation that did poorly. These are the optimization results with variations with more than 50 trades and CAR greater than 20. This gave 117 variations.
The difference in the results is still huge. In this case using synthetic data is clearly wrong.
Spreadsheet
Fill the form below to get the spreadsheet which contains all the variations tested and additional statistics for both methods. You can compare and see how each of the yearly results differ.
Final Thoughts
I am developing another VXX/XIV strategy to trade which uses VXX/XIV to signal. When I compared the real vs synthetic data, the results are dramatically different. Be careful when using synthetic data, you may throw out a good strat3egy or worse decide to trade a bad strategy.
Backtesting platform used: AmiBroker. Data provider:Norgate Data (referral link)
Good Quant Trading,

Fill in for free spreadsheet:
![]()


