Category Archives for "Research"

Are the markets like they were in March 2000, right at the top of tech-bubble? I have been seeing lots of facts about how expensive or extended this market is. The Schiller P/E ratio near the 2000 top. The Buffett Indicator at over 2 standard deviations, similar to the 2000 top. US Total Stock Market Value/GDP at all-time highs, far exceeding the 2000 top. The weight of the top 10 stocks in the S&P 500 above the 2000 top. $SOX index up 38% in April vs 50% in February 2000. On and on.
These all have me concerned. I traded during the Tech Bubble. Are we in a bubble? Probably. When will it burst? I don’t know.
Then I got curious how is the pure price action compared to then? At the Tech Market top, what percentage of Nasdaq 100 stocks had gone up more the 100% over the last year? How does that compare to now?
I was talking to my trading buddy and he mentioned that he read that 40% of Russell 3000 stocks are 30% or more off their 52-week high. To us that sounded really bad. But as usual, we asked is it? Or is this normal when we finally cross under the 200-day moving average after a long time being above it.
Going into this, I had lots of questions. How is this stat on the S&P500 stocks? How has the market done 6 to 12 months later compared to the average? Is the difference in performance significantly different from the average? Do we have enough occurrences of this pattern?
Something I am always thinking about is how the markets are behaving now vs the past few years vs several years ago. My edge on the strategies I trade depends on two main ideas. One, current market behavior is similar to what I tested on which is normally the last 5-10 years. Two, not too many others have found the same edge. Unfortunately for (2), more and more people are trading quant style and edges are harder to find and smaller when I do find them. The only thing I can control is continuing to research for new strategies.
This end of year rally which started on October 2023 has been strong. My trading buddy and I started wondering how this compares to the past. Is this a “normal” strong rally or an “abnormally” strong one?
Determining this is always tough because it depends on the indicators you use. Because of that, I tried lots of them. This will be a post short on words but with lots of tables.
Data is from 1/1/1980 to 12/19/2023. The close of 12/19/2023 was the 36th day of the rally. These are the stats based on these last 36 days.
Over the last 44 years, these are the average returns for all days for 5, 21, 63, 126, and 252. My main focus is on 126 & 252 days later.
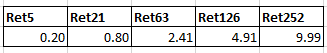
For each of the above stats, we will look at when it happened in the past and how the market did later. I ignore signals that happen within 21 days of the last one.
I was working on testing a market timing indicator that I read about it. It was showing some promise and the next step was to compare it to my benchmark. My benchmark is using the 200-day moving average. But an additional rule removes a lot of the whipsaws that can happen.
After doing the comparison, the market timing indicator compared well. But then I realized I had not written a blog post about my additions. I touched on it in the Market Timing with a Canary, Gold, Copper, LQD, IEF and much more post.
For me, the goal of using the 200-day MA to trade the SPY is to get about the same CAR but with a significant reduction in MDD.
My recent research has been on the volatility Exchange Traded Products. My focus has been on long trades using VXX and XIV. Although VXX has a very strong downtrend, I am not a fan of developing short strategies on it due to the huge upside risk. I wrote about XIV here and expressed some of the dangers of trading these ETFs.
UPDATE: These original results were published on October 26, 2016. Since then there have been lots of changes in the volatility ETFs/ETNs. Scroll down to Updated Results Through June 30, 2023 to see the updated results.
While reading the January 2023 issue of Technical Analysis of Stocks & Commodities, I came across an article about Efficiency Ratio (ER) by Perry Kaufman. In the article, he discusses using ER to decide when to trade mean reversion strategy vs a trend following one.
My curiosity on this was could I use the ER to filter trades in my mean reversion strategies.
From the Volume and Mean Reversion post, a reader sent a suggestion to instead use the ratio of 10 day moving average of the Close times Volume divided by the 63-day moving average of the Close times Volume (CV10/63). I had not tried this before and wanted to see how well it would work.
Overall, I have had very little success integrating volume into any of my strategies. Either volume would have no predictive value or if it did, using it reduced the number of trades too much to be worthwhile. It has been a long while since I have looked into this and I had some new ideas.
A common question I get is whether mean reversion is still working. My response is I am still trading a mean reversion strategy but the edges seem to get smaller. Over the year I have investigated this. I was asked again recently and wanted to investigate again. Here are the results of my 2022 investigation.
Test date range 1/1/2000 to 9/30/2022. I wanted to keep the rules simple. I tested various ways with the 200-day moving average. The reason for this is that some people only trade stocks above the 200, while I like to trade without. In general, this will have more volatility but better returns.