Category Archives for "General"

A strategy you have been trading for years has just had a terrible month. Looking at the market environment, you think these trades should not have been taken. You make some “small” changes to your strategy and now the backtest shows that the terrible month is OK and the overall strategy statistics improve. Should you keep that change in your strategy?
For the longest time, I would keep that change. But it felt like overfitting. Then I thought, this is making the strategy better so I should keep it. This issue came up recently from a strategy that just had its worst drawdown. How do I handle this situation now?
While talking to a trader, he mentioned an article in the December 2021 issue of Technical Analysis of Stocks & Commodities about Benford’s Law. I had read the same article and was wondering how it could be applied to my trading. Benford’s Law is often used to look for fraud. I am sure I am not committing fraud on myself. As we talked, we wondered whether this could help in selecting which strategy to trade from an optimization?
According to Benford’s Law, in a large set of numbers the significant digit is not evenly distributed but the digit “1” occurs the most frequently and the digit “9” the least. The theoretical distribution is shown in this chart.
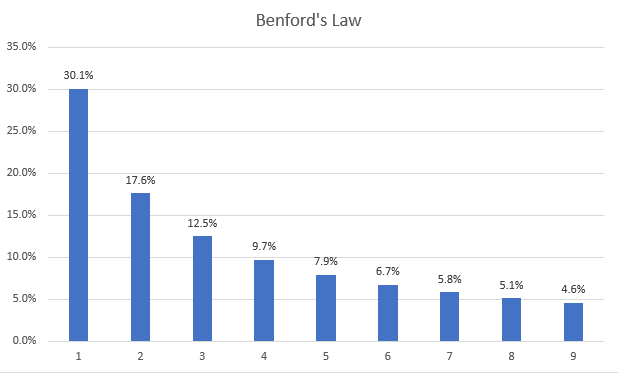
In general, for a data set to follow Benford’s Law, the data set should have the following properties
For more information about Benford’s Law, these are two good articles. What is Benford’s Law and why is it important for data science? and Wikipedia’s article Benford’s law.
Using the percentage daily return on stock data, here is how the data properties fit with what Benford’s Law wants in a data set
The data are not a perfect fit, but we will try and see what we get.
From 2007 to 2021, here are the results of the significant digit count on the daily percentage return on the SPY
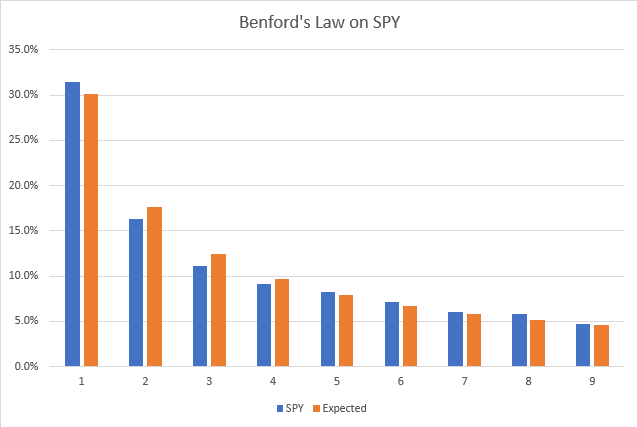
Visually the SPY appears to follow Benford’s Law. There are several statistical methods for determining if it does follow. I will be using the Chi-Square Statistic. What we need to know about this value is the lower the better. If there was a perfect match between the data set and the theoretical distribution, the value would be zero. Typically, a value under 15.5 is used to determine if the data does follow Benford’s Law. The Chi-Square Statistic for the SPY data is 17.9. Close to the cutoff. I guess perhaps the SPY is slightly manipulated.
Next, I was curious about how the individual stocks of the S&P500 behaved. I used the current S&P 500 stocks and data from 2007 to 2021.
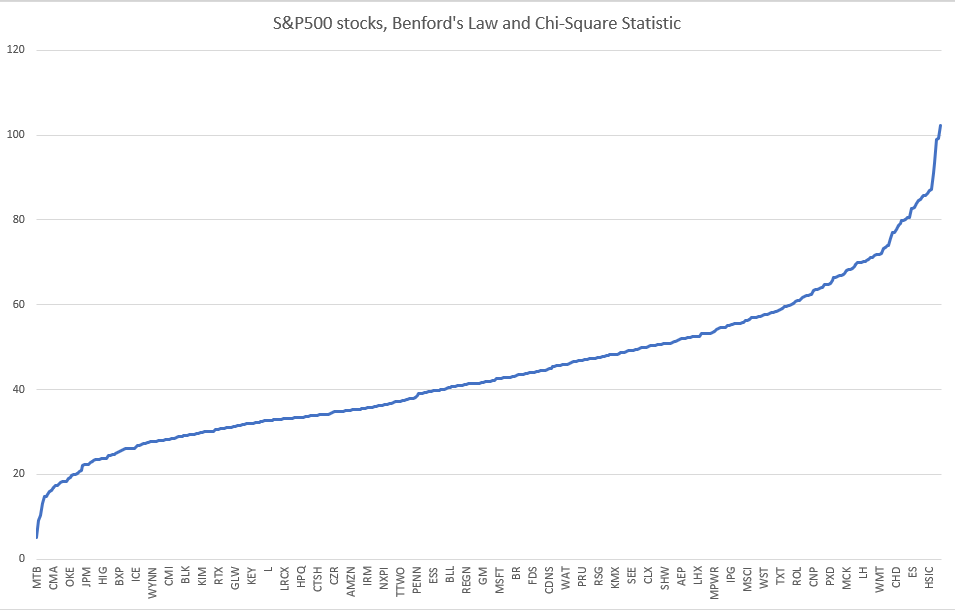
Values for the Chi-Square range from a low of 5 for MTB to a high of 102 for AWK. The average for all was 44.4. Only seven stocks had values under 15.5. Either one of two things is going on here. One, these stocks are highly manipulated. Or two, the data is not a good fit to apply Benford’s Law. I am going with number two because I am an optimist and believe the markets are only slightly manipulated.
Now to what I wanted to know. Is there any predictive value here for selecting a strategy from an optimization run?
I ran an optimization (432 runs) on a momentum strategy that I trade from 2007 to 2016. I took the top 1/3 of the runs (145 runs) based on CAR and computed the Chi-Square Statistic for each based on the daily % return of the strategy. From the Chi-Square Statistic, I divided these into terciles.
Side note: I thought the Chi-Square Statistic was big for the S&P 500 stocks. In my optimization run, the range was from 210 to 2143. Not even close to following Benford’s Law!
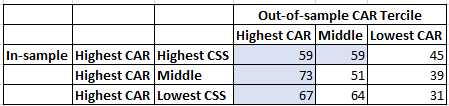
Then using an out-of-sample optimization, I computed the CAR tercile that each of these in-sample runs fell into. My hypothesis was that failure to follow Benford’s Law implied a higher potential for curve fitting, which then implies that those in-sample runs in the top tercile for CAR and bottom tercile for Chi-Square Statistic would again end up in the top tercile for CAR in the out-of-sample.
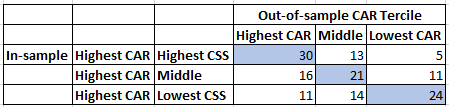
The numbers in the table represent how many runs fell into that cell, with a blue background highlighting the highest value in that row The first row represents 48 runs from the in-sample that fell into the top tercile by CAR and then the top tercile by Chi-Square Statistic for that top tercile. The blue 30 then means that 30 of those 48 runs end up in the top tercile by CAR in the out-of-sample.
At first, I was excited by the very clear diagonal line and the fact that the other cells followed what I expected. But then I realized this was the opposite of what I thought. I expected the lowest tercile by Chi-Square Statistic to be most likely to stay in the top CAR tercile. I started making up stories to explain this, but then I realized I should test this on a different strategy.
Following the same process that I used for the momentum strategy, here are the results of a mean reversion strategy.
Now, it is random. No pattern at all. Too bad.
I want to thank Matt Radtke for helping proof this article. The first time I sent it to him, he caught a huge logical mistake that I had made. It would have been embarrassing to publish an article with such a bad mistake. That is also the reason it has been so long since my last post. I had to redo a lot of the work I had done.
As often happens in research, an interesting idea leads nowhere. Given that the data do not follow the requirements for applying Benford’s Law, I am not too surprised by the results. This was a good lesson for me on not stopping when I got the first good results. Even had the results panned out, I am not sure I would have used them. No story that I could make about why this should work made me comfortable. And we must be comfortable with the reasons we are trading our strategies.
Backtesting platform used: AmiBroker. Data provider: Norgate Data (referral link)

I’ve been seeing lots of seasonality type charts on the S&P500 where they take the average return for each day of the year and then create a return curve for the year. The chart often ‘shows’ the sell in May and buy in November flatness of the returns. And then the holiday end of the year run up.
Steven, my trading buddy, sent me yet another chart and I noticed something I had not seen before. A beginning of the year downtrend from January to mid-March. This got me thinking. How much does the start of the data set impact these charts?
I just got back from a long vacation in Iceland (highly recommend visiting). As usual, when people discover what I do, they ask me about the markets. Several people were worried that the markets are too high. Then I read that the 20-year return of the SPX from 2001 to 2020 was way below the average 20-year return. My thinking was how could the massive run since 2009 not have gotten us above the average. As usual, I had to test it.
The most common question I get is how do you determine that a strategy is no longer working. It is also the question that I don’t have a good answer for. I have written several posts about this: Trading the Equity Curve, How to turn off a strategy using historical volatility, Broken Strategy or Market Change. During his How to detect a failing trading strategy presentation, Kevin Davey discusses how he uses probability cones to determine when to stop trading a strategy. I had not investigated this concept and was very intrigued.
A very common question I get, is “when should I turn off a strategy?” Given the very volatile markets we have had the last few months, I can relate. Some strategies can thrive in these high volatility markets. While others can suffer.
In the June 2020 issue of Technical Analysis of Stocks and Commodities, Perry Kaufman writes an article about using the historical volatility of the equity curve to decide when to turn off a strategy. I always read Perry’s articles because they are full of good ideas and this was another one that I liked and had not tried before.
I have been waiting for a close under 2350 to write this post. Today the $SPX closed at 2304.92.
Markets slowly grind up. But crash quickly. How quickly? I will be looking at each new drawdown low since the market top on February 19, 2020 and then seeing how many days of market gains were erased since the previous time
A very strong parallel between Brazilian Jiu-Jitsu (BJJ) and trading is the chasing of the shiny new toy. In BJJ, we often want to learn the new submission (Peruvian Necktie or Snake in the Grass Choke) we saw on YouTube. Or the new type of guard (Lapel Guard or 50/50 Guard). In trading, this is chasing the new technical indicator or new position sizing method or new strategy we read on some blog.
I have been practicing martial arts for the last 21 years and Brazilian Jiu-Jitsu (BJJ) for the last 9 years. Over the years I have come to appreciate how BJJ helps my trading. And also, how my trading helps my BJJ. The lessons and similarities go both ways.
Due to a recent injury, more details at the end, I am out of BJJ for the next 6 weeks. I plan to write several posts about how BJJ influences my research and trading to keep thinking about BJJ. These posts will be short and interspersed between my regular posts.

One of my favorite parts about BJJ is that it forces you to focus. At the start of class, I am often still thinking about the research and trading day. I may be happy with my trading results for the day. Or thinking about a solution to research project or how to improve a client’s strategy.
But I must quickly focus on the class and my training partner. He will soon be actively be trying to break my arm or shoulder or leg or choke me. There is nothing like being “attacked” to force you to focus.
Being a smaller, older & lighter guy with most of the other students being 50% or more heavier than I, means I have little room for error. The focus comes quick and I forget about the day I had.
The benefit to this focus usually comes after class in the shower. That is when I will frequently come up with new trading ideas or solutions. The time of not thinking about the day lets ideas ruminate in the back of my brain.
As much as I love researching and trading the stock market, this time to not think about it is critical. Find your activity that forces you to stop thinking about the market. Even going for walks in nature, my best method for finding solutions, works surprisingly well.

solvitur ambulando
Injury report. I tore my left medial meniscus. To be more specific, I had a bucket-handle tear. As to how it happened. Well it was wear and tear of 21 years of martial arts, plus a previous ACL surgery plus getting old. The straw that tore the meniscus, was a 6 inch jump in the air.
I just got surgery last week to fix it. All is going well and pain free. Now comes the hard part. Taking it easy to allow it to heal.
In my last post, Avoiding Trades Before Earnings, I mentioned that I used Quantopian to do the research. Several readers asked about my thoughts about Quantopian and how it compares to AmiBroker. Some asked if I had left AmiBroker for Quantopian. What follows are my impressions after using Quantopian for several months and how it compares to AmiBroker.
The big question is will I be switching from AmiBroker to Quantopian for my backtesting?