Author Archives: Cesar Alvarez

May 12, 2026
- in Research by Cesar Alvarez
The 100% Club. 2000 Tech vs 2026 AI
Are the markets like they were in March 2000, right at the top of tech-bubble? I have been seeing lots of facts about how expensive or extended this market is. The Schiller P/E ratio near the 2000 top. The Buffett Indicator at over 2 standard deviations, similar to the 2000 top. US Total Stock Market Value/GDP at all-time highs, far exceeding the 2000 top. The weight of the top 10 stocks in the S&P 500 above the 2000 top. $SOX index up 38% in April vs 50% in February 2000. On and on.
These all have me concerned. I traded during the Tech Bubble. Are we in a bubble? Probably. When will it burst? I don’t know.
Then I got curious how is the pure price action compared to then? At the Tech Market top, what percentage of Nasdaq 100 stocks had gone up more the 100% over the last year? How does that compare to now?
May 6, 2026
- in General by Cesar Alvarez
Bad Month for Your Strategy? Should You Change It?
A strategy you have been trading for years has just had a terrible month. Looking at the market environment, you think these trades should not have been taken. You make some “small” changes to your strategy and now the backtest shows that the terrible month is OK and the overall strategy statistics improve. Should you keep that change in your strategy?
For the longest time, I would keep that change. But it felt like overfitting. Then I thought, this is making the strategy better so I should keep it. This issue came up recently from a strategy that just had its worst drawdown. How do I handle this situation now?
March 17, 2025
- in Market Timing , Research by Cesar Alvarez
The 30% Selloff Signal: What History Tells Us About Market Recoveries
I was talking to my trading buddy and he mentioned that he read that 40% of Russell 3000 stocks are 30% or more off their 52-week high. To us that sounded really bad. But as usual, we asked is it? Or is this normal when we finally cross under the 200-day moving average after a long time being above it.
Going into this, I had lots of questions. How is this stat on the S&P500 stocks? How has the market done 6 to 12 months later compared to the average? Is the difference in performance significantly different from the average? Do we have enough occurrences of this pattern?
November 13, 2024
- in ETFs , Market Timing , Rotation by Cesar Alvarez
SPY, SSO and TLT Strategy
A reader sent a strategy to test which is a basic monthly rotation strategy between stocks and bonds. What caught my attention was the use of SSO, the 2x of S&P 500. The main idea being to use SSO when in a low volatility bull market.
Looking over the rules, I could tell this strategy was created before the recent bear market in bonds.
August 23, 2024
- in Market Timing by Cesar Alvarez
Bear Markets Through the Decades
Several months ago, Steven (my trading buddy) and I were talking about bear markets. I felt that bear markets seem shorter and shallower now compared to the past. I thought this would be a quick and easy research project and blog post. Nope. As I generated numbers, more questions and research paths would be generated.
My questions are
- Are bear markets shorter?
- Are bear markets shallower?
June 12, 2024
- in ETFs , Market Timing by Cesar Alvarez
Sell in August and Go Away
I was going through some old issues of Technical Analysis of Stocks & Commodities looking for some ideas to test. In the November 2019 issue, I came across “Stock Market Seasonality: A Global Phenomenon” by Jay Kaeppel. The basic idea was that global markets share the same “buy in November and sell in May” phenomenon as the US market.
This got me thinking about how markets have changed since 2012 or so. My theory is that before 2012, this pattern was better than either buy and hold or other start and end months. But after this time, buy and hold or longer hold dates would be better. The reason is that the Fed is involved in the market more and keeping bear markets much shorter.
March 27, 2024
- in ETFs , Market Timing , Rotation by Cesar Alvarez
UPRO/TQQQ Leveraged ETF Strategy
Recently a reader sent me a leveraged ETF strategy that he wanted tested for the blog. Over the last couple of months, I have been noticing renewed interest in leveraged ETF trading. More clients are coming to me to test out leverage trading ideas. I have been testing my own ideas. What I liked about this strategy is that it moved between leveraged ETFs, non-leveraged ETFs and TLT.
January 24, 2024
- in ETFs , Mean Reversion , Research , Trend Following by Cesar Alvarez
Mean Reversion vs Trend Following Through the Years
Something I am always thinking about is how the markets are behaving now vs the past few years vs several years ago. My edge on the strategies I trade depends on two main ideas. One, current market behavior is similar to what I tested on which is normally the last 5-10 years. Two, not too many others have found the same edge. Unfortunately for (2), more and more people are trading quant style and edges are harder to find and smaller when I do find them. The only thing I can control is continuing to research for new strategies.
December 20, 2023
- in Research by Cesar Alvarez
2023 Rally – How Strong Is It?
This end of year rally which started on October 2023 has been strong. My trading buddy and I started wondering how this compares to the past. Is this a “normal” strong rally or an “abnormally” strong one?
Determining this is always tough because it depends on the indicators you use. Because of that, I tried lots of them. This will be a post short on words but with lots of tables.
Where are we now?
Data is from 1/1/1980 to 12/19/2023. The close of 12/19/2023 was the 36th day of the rally. These are the stats based on these last 36 days.
- 18 days with RSI2 over 90
- 6 days with RSI2 over 99
- 20 days with RSI4 over 80
- 27 days with the close above the previous day’s close
- 5 days with close above the upper Bollinger Band(15,2)
- 15.8 total return in those 36 days
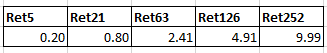
Over the last 44 years, these are the average returns for all days for 5, 21, 63, 126, and 252. My main focus is on 126 & 252 days later.
For each of the above stats, we will look at when it happened in the past and how the market did later. I ignore signals that happen within 21 days of the last one.
November 15, 2023
- in ETFs , Rotation by Cesar Alvarez
Sector Rotation Strategy: Should Trading Rules Make Sense?
I was doing my usual reading when I came across a sector rotation strategy. I have seen lots of these strategies but this one had a different twist. The strategy was a momentum strategy but instead of buying the top three, it was buying the middle three. The article gave no reason other than it works and gives the best results.
In general, people fall into two camps about trading rules.
- The trading rules need to make sense on why they are there.
- Don’t care about the rules if the stats are good and over-fit tests pass.