- in Mean Reversion , Stocks by Cesar Alvarez
N-Day exits with Mean Reversion
My last post on using PercentRank to measure mean reversion proved very popular. A reader looked at the trades and wondered if it would be best to exit after five days because the average trade with longer holds was a loser. I am surprised I have not covered this topic before.
Background
Early in while working for Larry Connors, I had done a mean reversion test. I was looking at the trades and noticed that after 8 days, the average trade was a loser. I thought, great just exit after 8 days and I should see a big jump in returns. Nope, the return and drawdowns got worse. For several years, I kept coming back to this but it never worked. Sometimes it would help some but changing the hold amount a little changed the results too much. In the end, it was better to just wait for the bounce. It has been a long time since I have looked at this. Have things changed?
Strategy
We are using the same strategy from Using recent returns for Mean Reversion. See it for more details, especially on PercentRank.
Test dates: 1/1/2006 to 11/30/2016
Setup
- Stock is member of the Russell 1000 index
- The price of the stock is greater than $1. Want to avoid very low priced stocks
- The 21 day moving average of Close time Volume is greater than $10 million. Want to make sure there is liquidity.
- The close is above the 100 day moving average.
- The 252 day PercentRank of the 2 day returns is below 5
Buy
- Enter at a limit price today at 1/2 of ATR(10) below previous close
- 5% of portfolio in each position
- Only enter orders so if they all fill will not have over 8 open positions
Sell
- 2 period RSI greater than 40
- Exit on next open.
Trade Summary
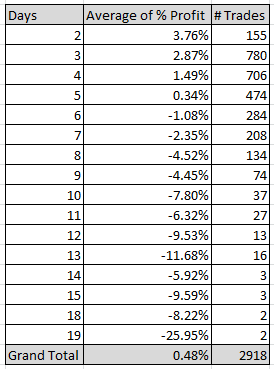
I took the trade list and created a pivot table in Excel.

From this we can see after being in the trade 6 bars, on average the trade will be a loser. Obviously, we should get out after 6 bars, right?
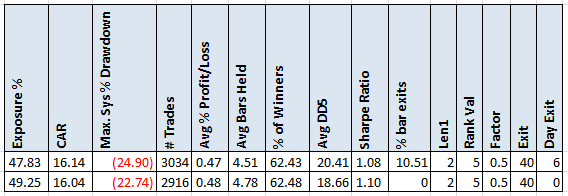
Six bar exit

Exiting after 6 bars has the same CAR with a worse drawdown. About 10% of the trades are exited after 6 bars. No improvement here. I normally don’t keep rules that don’t improve a strategy. But this rule I would consider keeping because it would help me to continue to trade the strategy. One would not be in any long losing trades.
Longer Holds
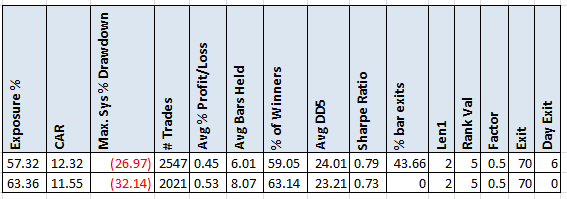
Maybe we see little improvement because of the low RSI exit. What happens if we use a RSI2 greater than 70 exit?
With 44% of the trade exiting because of the 6 bar rule, now we see some improvement in CAR and quite a bit in MDD. Is this specific to this variation?
Optimization Comparison
Next I ran an optimization using these parameters.
Setup
- The 252 day PercentRank of the (2,3,4,5) day returns is below (5,10,15)
Buy
- Enter at a limit price today at (.50,.75) of ATR(10) below previous close
Sell
- 2 period RSI greater than (40,50,60,70,80)
- Exit if in position after (NA,1,2,3,4,5,6,7,8,9,10) bars
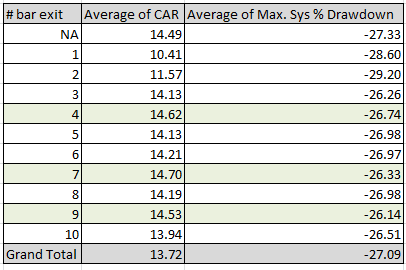
I took these results and created this pivot table.
Each row represents 120 variations. We can see that the 4, 7 and 9 day exits beat the baseline of not using this exit. But the improvement is minor and not consistent.
Spreadsheet
Fill the form below to get the spreadsheet with lots of more information. This includes other values for parameters, yearly breakdown, worst 5 drawdowns and more statistics.
Final Thoughts
From the initial trade evaluation, it looked like the results could be improved by exiting early. Using this type of exit did not change the results much. Sometimes a little better and in others a little worse.
I use this type of exit in some of my strategies not because they improve results but because psychologically it is better than staying in a very long loser. For this reason, you should consider this exit.
Backtesting platform used: AmiBroker. Data provider:Norgate Data (referral link)
Good Quant Trading,

Fill in for free spreadsheet:
![]()


