- in Research by Cesar Alvarez
Can A Simple Market Timing Indicator Be Beat?
As long time readers of my blog know, I often use a market timing indicator in my strategies. My favorite one, and a simple one, is using the 200 day moving average on either the SPY or S&P 500 Index. I recently ran into these posts, Using Market Breadth To Gauge Market Health (Part 5) and Matt’s Breadth Indicator. Matt’s Breadth Indicator (MBI) intrigued me because I had not seen something like this and conceptually it is simple. I also liked that it was not “easy” to test or optimize on. Therefore hopefully not many people would be using this indicator and I could potentially find better values.
Trust but Verify
From the site
This next market breadth indicator counts all the stocks in the Russell 3000 that are up at least 30% over the last quarter (60 trading days), as well as all the stocks that are down at least 30% for the last 60 days. I’m using historical constituents of the Russell 3000 including delisted stocks to avoid survivorship bias. I am optimizing over the period of 2010-2012 inclusive, and our out-of sample data is 2013-2015 inclusive (well, almost to the end of the year). I also take a look at a wider period of 2000-2015 to see if the system holds up.
We calculate diffusion as before:
dif30qtr = total_up_30 / ( total_up_30 + total_down_30 ) * 100
I’m multiplying by 100 to give it a percent-y feel, but that part isn’t strictly necessary.
As always the first step is to replicate the results from the site. Matt was very helpful in answering questions and I was able to closely replicate his results.
Original Rules for trading SPY using
Buy: When MBI is above 75 for 10 or more days
Sell: When MBI is below 75 for 10 or more days
Changes
I do not agree with his universe selection of using the Russell 3000. Since I trade S&P500 and S&P100 stocks, I am changing the universe to S&P 500 stocks. In his testing, the in sample period is only 3 years (2010-2012) which I find too small. When I am testing a market timing indicator, I like to make sure I capture a full bull-bear cycle at least.
In Sample Test
Date range: 1/1/2007 to 12/31/2016. Symbol traded SPY.
Optimization values:
R = [10,15,20,25,30,35,40,45,50]
LOOKBACK = [20, 40, 60, 80, 100, 120, 140, 160, 180, 200, 220, 240]
CUTOFF = [40, 45, 50, 55, 60, 65, 70, 75, 80]
NDAYS = [2, 4, 6, 8, 10, 12, 14, 16, 18, 20]
MBI = 100 * (# of stocks up R% over the last LOOKBACK days)/( (# of stocks up R% over the last LOOKBACK days)+ (# of stocks down –R% over the last LOOKBACK days))
Buy: When MBI is above CUTOFF for NDAYS or more days
Sell: When MBI is below CUTOFF for NDAYS or more days
This gives 7776 variations, which is a lot but I had no idea what was originally tested or had any strong guesses of what values were good.
Results
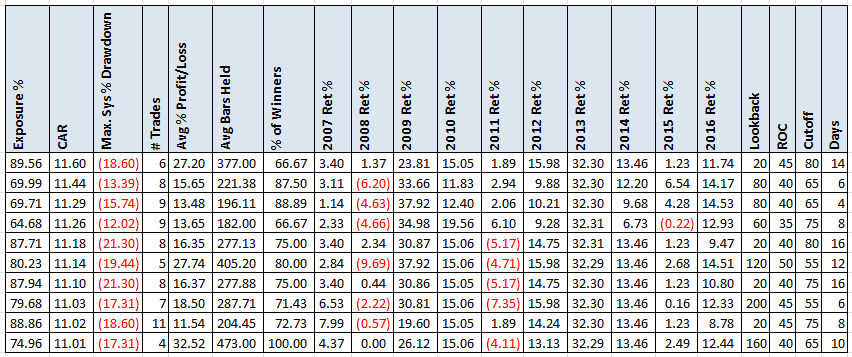
Here we have the top 10 results.
These are good looking numbers. Of course we would trade none of these top runs because they are likely curve fit. Notice though how few trades there are. This is where we must be careful in making decisions based on about 10 trades.
From the optimization, I narrowed the results down to those with a CAR between 9 & 10 and an Ulcer Index between 5 & 7, then used the histogram method, describe in ConnorsRSI Strategy: Sensitivity Analysis, to pick a variation. How did the original MBI and the histogram values do?
It is a great sign to see that the MBI values held up during a longer backtest and using the S&P500 index stocks. How does this compare to my simple market timing baseline?
MA200 Baseline
Buy: Close is above the 200 day simple moving average for 10 or more days
Sell: Close is below the 200 day simple moving average for 10 or more days
Both MBI & Histogram have better CAR and MDD. They are not significantly more.
Out of Sample Test
Given that there are so few trades, it is important to do the out of sample test. How did these indicators hold up from 1997 to 2006?
Wow, what a surprise here. Both the MBI & Histogram methods did poorly during this time. Very low CAR and very high MDD. The MA200 method held up great. Sometimes simple is better
Spreadsheet
Fill the form below to get the spreadsheet with the results and many more stats. Included are the full optimization results so you can look at other values. Results of using different values for the MA200 method are shown too.
Final Thoughts
Again the simple 200 day moving average wins out over more complicated methods. But these results are for trading the SPY. What if the indicator was used when trading a strategy that trades the S&P 500 stocks?
Backtesting platform used: AmiBroker. Data provider: Norgate Data (referral link)
Good quant trading,

Fill in for free spreadsheet:
![]()


