- in Mean Reversion , Stocks by Cesar Alvarez
Mean Reversion Entry Timing
One of the first tests I did when I got AmiBroker twenty years ago was a mean reversion test. It was a classic set up, a stock in an uptrend, followed by a pullback. But the entry differed from what I do now. The entry waited for a confirmation of the trend back up. The trade would enter when the stock crossed above the previous day’s high. The exit was also different. The exit was on a close below the lowest low of the last (2,5) days. The results were not very good, so I gave up on it. I did not do test entering on the open or on further intraday pullback or exiting on the bounce. If I had, I would have started my mean reversion trading several years earlier, which would have added several more years of large edges trading. Oh well, I was just a beginner researcher then.
Recently I got curious about waiting for confirmation before entering a trade. Now that I know more about entries and exits, would it give good results. How would these results compare to waiting for further intraday pullback or entering at the open? Time to discover.
The Setup
Testing was done from 2007 to 2017.
- Stock is member of the S&P500 index
- 2-period RSI of stock is under (5,10,15,20)
- Stock is above the 100-day moving average (the spreadsheet also has results for 50, 150, 200). I choose 100 just to be different from my normal testing.
- Today’s MA100 is greater than the MA100 21 days ago. We want moving average in an uptrend
- The SPX is above the its 200-day moving average. Want a bull market.
On setup, we have one of three ways of entering: on the next open, intraday selloff, intraday trend resumption. Signals are ranked from highest 100-day historical volatility to lowest. Invest in a maximum of 7 stocks at 14.2% per position. I forgot how I ranked the signals or position sizing from 20 years ago but this alone could make a big difference.
First, we will look at using an RSI exit.
Entry on Open – RSI Exit
Entry
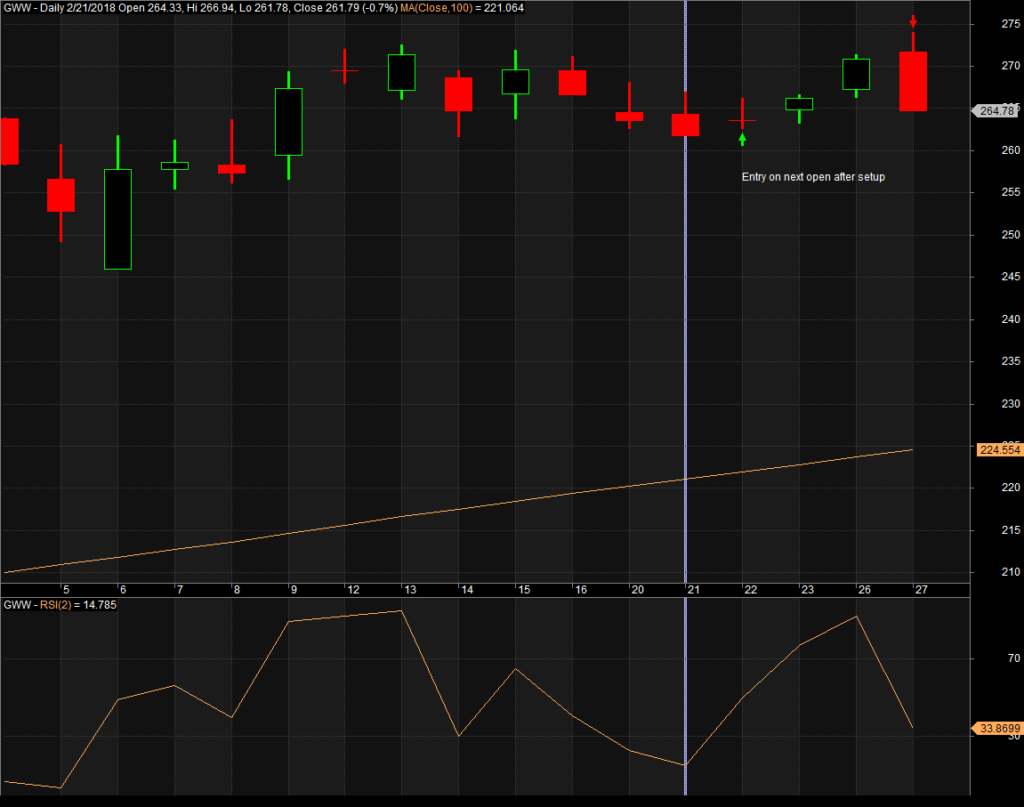
- If previous bar is a set up, then enter at the open
Exit
- If 2-period RSI closes above (20,40,60,80) exit on next open
Results
For all the comparisons, we will be looking at the top 5 runs and the average of those. For space reasons I am not showing the 2007 & 2008 results but they are in the spreadsheet.
This the standard mean reversion strategy. From here we will compare the results. The CAR is about where I would expect giving that the strategy is trading S&P500 stocks. I would expect better results using the Russell 3000. The % winners at 65% and low are Avg % p/l are as expected.
Intraday Pullback – RSI Exit
This is my favorite method to enter my mean reversion trades.
Entry
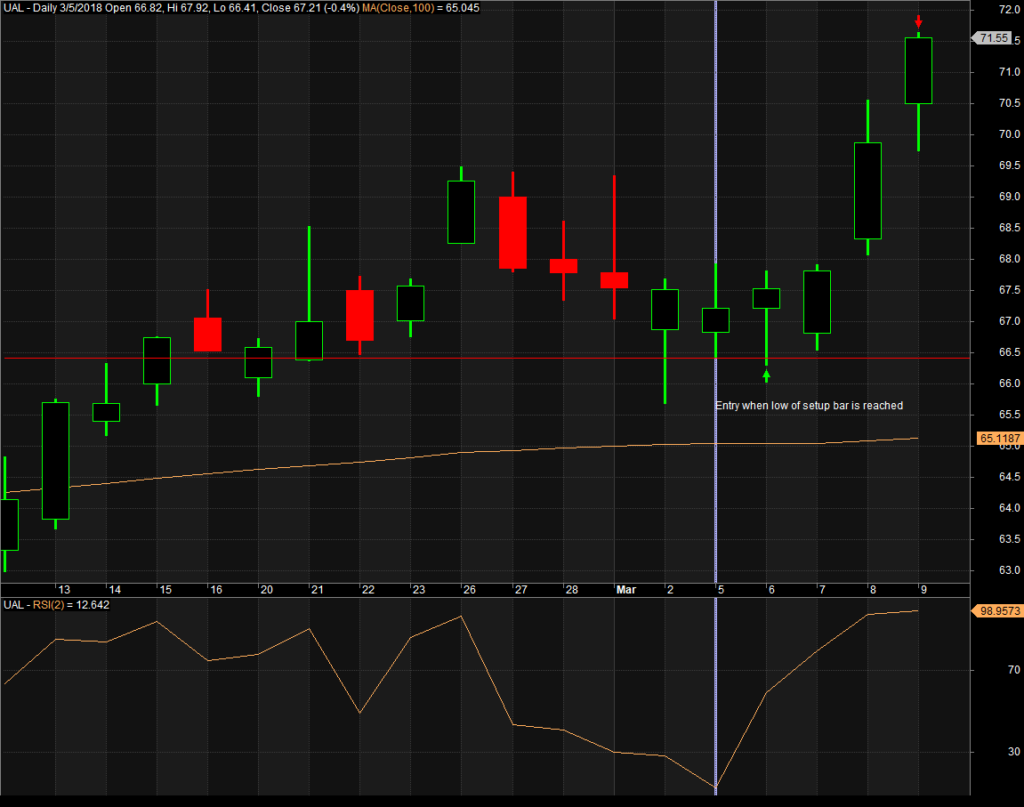
- If previous bar is a set up, then enter at a limit price at the previous day’s low.
- Only place the number of orders so if they all are filled, then will be in 7 positions. No leverage is used.
Exit
- If 2-period RSI closes above (20,40,60,80) exit on next open
Results
This really did surprise me. I expected the CAR and the Avg % p/l to be significantly higher than “Entry on Open, RSI Exit.” The yearly comparison with “Entry on Open, RSI Exit” is about the same most years. I was surprised that the Intraday pullback did better in 2017.
Trend Resumption – RSI Exit
Entry
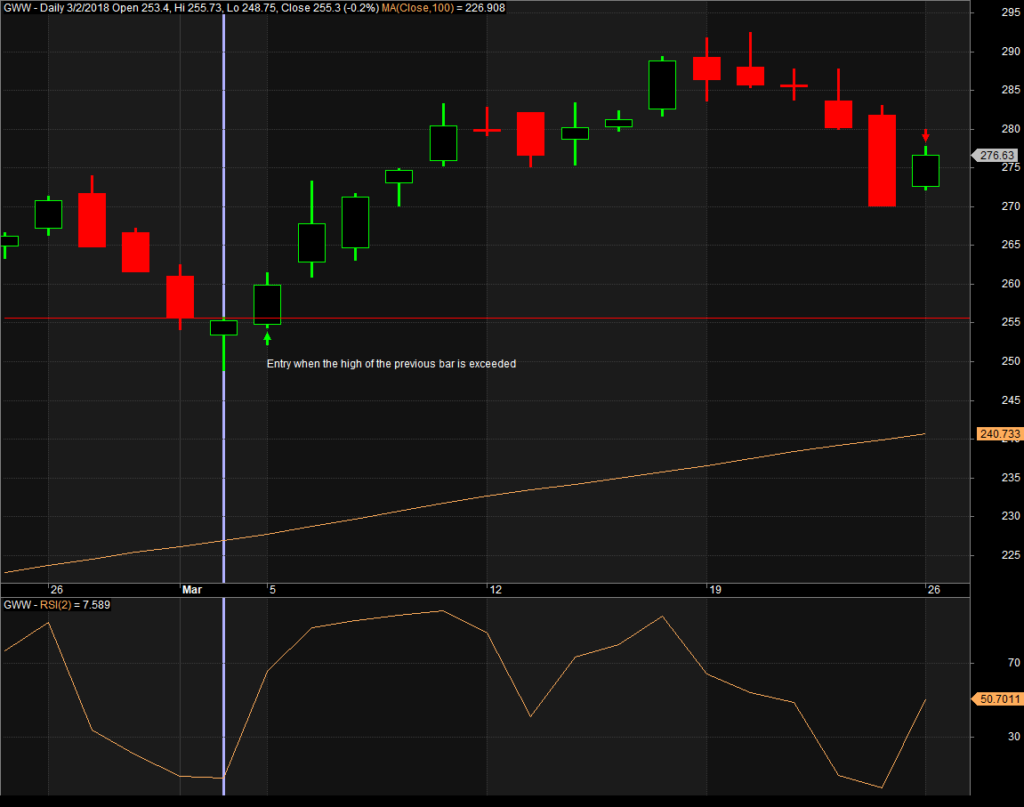
- If previous bar is a set up and today the high is greater than previous day’s high, then enter at the previous day’s high.
Exit
- If 2-period RSI closes above (20,40,60,80) exit on next open
Results
Again I am surprised. The average CAR is much higher than I expected. This has the best run so far with 16.02 CAR but notice how quickly the CAR drops. This is not a good sign. This is not the typical exit for this type of trade but I wanted to use the RSI exit to compare with the other two entry types.
Entry on Open, N-Day Exit
In this case, I do a trailing stop of the N-day low of lows because this is the stop used for the trend resumption entry.
Entry
- If previous bar is a set up, then enter at the open
Exit
- If today’s close is below the (2,5,10,15,20) day low of lows, then exit on next open
Results
The average CAR being better than the RSI exit surprised me. I was not expecting this. The higher MDD did not surprise me. The RSI exit had an average hold of 7 bars vs 21 bars here. Some big differences in the year return. For 2017 you have 5.60% vs 22.32%. Also notice that with the n-day low exit we are now have winners at 29% vs 65% for the RSI exit. This is more like a trend following for % winners.
Intraday Pullback, N-Day Exit
Now this is not the typical exit for this entry.
Entry
- If previous bar is a set up, then enter at a limit price at the previous day’s low.
- Only place the number of order so if they all are filled, then will be in 7 positions. No leverage is used.
Exit
- If today’s close is below the (2,5,10,15,20) day low of lows, then exit on next open
Results
The surprises keep on coming. The CAR is the highest of all the tests but then so is the MDD. I was expecting poor performance on this test. Again the low % winners would make this hard to trade. Look at how slowly the CAR drops that is a good sign. I must investigate this more.
Trend Resumption, N-Day Exit
This is the test from 20 years ago.
Entry
- If previous bar is a set up and today the high is greater than previous day’s high, then enter at the previous day’s high.
Exit
- If today’s close is below the (2,5,10,15,20) day low of lows, then exit on next open
Results
These results are better than expected. I was expecting a negative CAR. But they are still much worse than the other results. Waiting for the confirmation that the trend is going back up, costs you. Compare these results with the “Entry on Open, N-Day Exit” with the CAR almost double.
Spreadsheet
Fill the form below to get the spreadsheet with all the results and additional stats. See yearly breakdown and many more value.
Final Thoughts
These tests were full of surprises for me. The most significant one being the “Intraday Pullback, N-Day Exit.” I must do more research on that. Maybe a future blog post. What this help remind of is never make assumptions about what the test results will be. And more important back to old tests. Sometimes markets change or even more important, we have learned more about how to enter and exit trades that makes a difference.
Backtesting platform used: AmiBroker. Data provider: Norgate Data (referral link)
Good quant trading,

Fill in for free spreadsheet:
![]()


