- in Mean Reversion , Research , Stocks by Cesar Alvarez
Is mean reversion dead?
My great friend and expert trader Steven Gabriel often pushes me to answer this question; and prove it. We, perhaps too fondly, remember the great mean reversion trading years of 2005, 2006, 2008, 2009, 2010. We discussed this topic often in 2011 and 2012. Steven Gabriel would often call me on days when in the past, we would both be making 5+% on a day that our stocks would be mean reverting, but now we would be making a mere 1%.
My theory is that mean reversion is in hibernation waiting to come back; or said another way, mean reversion is simply mean reverting. I think that when too many people trade mean reversion, the space gets crowded and we see fewer winning trades and smaller returns. However, this has always been conjecture never backed up with numbers. Are we really seeing fewer trades? Smaller returns? Time to do the research and see what the numbers tell us.
The Test
Testing Universe: Top 1,000 stocks by dollar-volume with closing price greater than $1. No ETFs included.
Date Range: 1/1/2001 to 8/30/2013
Entry:
- RSI(2) < 5
- Entry on Close
Exit:
- RSI2 > 70
- Exit on Close
I performed an “All Days” test. This means we can have multiple entries in the same stock at the same time. In a situation where an oversold stock continues on a journey downward day after day-the test will take each trade each day as a new independent trade if the stock continues to meet the filter criteria.
The Results
Number of trades
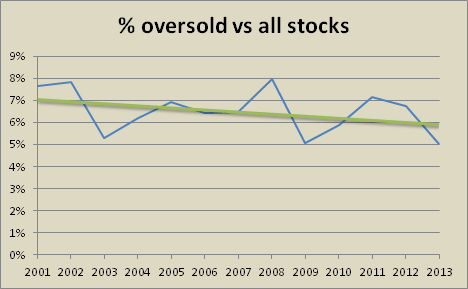
The first question is as a percentage are there fewer stocks becoming oversold?
The blue line is the percent of stocks with RSI2 < 5 compared to all the stock for a given year. This has hovered between 5.1% in 2009 and 8.0% in 2008. The green line is a liner regression of the data. We can see that the trend has been down since 2001 but not a lot. The trend from 2005 to 2007 compared to the trend from 2011 to 2013 looks very similar. Is this trend because we are in the same cycle of a bull market? Is mean-reversion in hibernation? Given the trade data, I would say yes. Nothing appears out of the ordinary.
Average % profit/loss
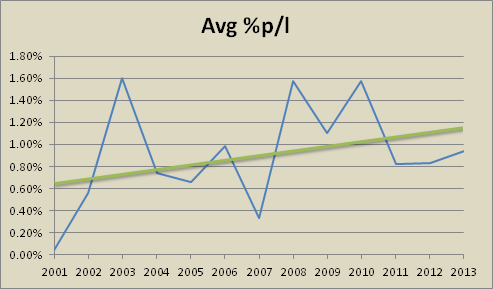
What has been happening to average % profit/loss over the years?
This chart surprised me. The blue line is the average % profit/loss of all the trades with RSI2 < 5 and the exiting when RSI2 > 70. The green line is a linear regression of the data. The last thing I expected was an up sloping linear regression line. The 2013 average % profit/loss is .94% substantially less than the 2008 and 2010 values of 1.58% and 1.57% respectively. But 2013 returns are higher than 2011 and 2012 and substantially higher than 2007’s value of .33%.
Conclusion – Mean Reversion is coming out of hibernation
We are at the low of the number of sold off stocks per year but the average # profit/loss is the middle range. The numbers do not tell me anything is out of whack with mean reversion. Mean reversion is not dead but it looks like it is coming out of hibernation. I have more ideas on how I want to slice this data and additional tests I will be doing over the coming weeks.
So, there you go Steven. Mean reversion is not dead, but it has been sleeping and it appears that it is ready to come out of hibernation.
Comments, suggestions or ideas on further tests on this topic? Put them in the comments window below!
Backtesting platform used: AmiBroker. Data provider:Norgate Data (referral link)


