December 5, 2013

Monthly S&P500 Stock Rotation Strategy


From the “Should You Buy the Best or Worst YTD Stocks” post, several readers made comments if one could make a monthly rotation system from this idea. From that post, buying either the strongest or weakest stocks out-performed the SPX with the weakest giving the best results. Will that be the case again?

Test Parameters

  • From 1/1/2001 to 10/31/2013
  • $.01/share for commission
  • 3 month T-bill interest rate used for cash


Best N Month Rules

  • It is the first trading day of the month
  • Stock is a member of the S&P500
  • Rank stocks from the highest to lowest by (6,12) month return
  • Buy the top 20 ranked stocks at the close
  • Optional market timing rule: SPX close > 200 day moving average of SPX closes on the entry day
  • Hold until next month


Worst N Month Rules

  • It is the first trading day of the month
  • Stock is a member of the S&P500
  • Rank stocks from the lowest to highest by (6,12) month return
  • Buy the top 20 ranked stocks at the close
  • Optional market timing rule: SPX close > 200 day moving average of SPX closes on the entry day
  • Hold until next month


Results

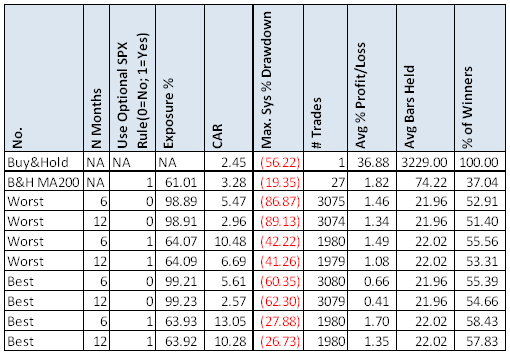
WorstBestRotation1

The concept has possibilities as a trading strategy. What jumps out is that both the worst and best variations outperform the Buy and Hold variations. The scary stat is the horrendous drawdowns. I can’t believe that one of the variations had an 89% drawdown but still outperforms Buy and Hold. Not a strategy I would trade but something that has lot more potential than I expected.


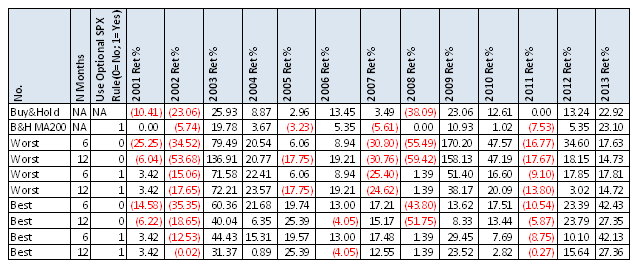
Looking at the yearly returns:

WorstBestRotation2

Some years it is better to buy weakness and some years, as this year is, it is better to buy strength.

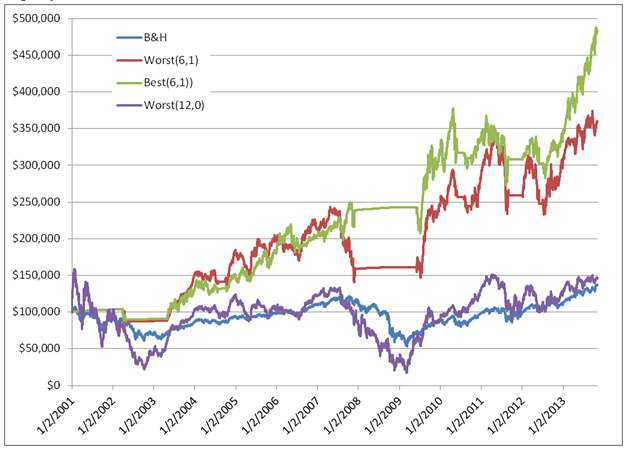
Equity Curves

WorstBestRotation3

  • B&H = Buy & Hold
  • Worst(6,1) = Worst 6 month return ranking. Using the market timing rule
  • Best(6,1) = Best 6 month return ranking. Using the market timing rule
  • Worst(12, 0 ) = Worst 12 month return ranking. No market timing rule


Spreadsheet

If you’re interested in a spreadsheet of my testing results, enter your information below, and I will send you a link to the spreadsheet. Along with the above results the spreadsheet includes buy the 10 & 50 stocks each month and look backs of 3 and 9 months.

Backtesting platform used: AmiBroker. Data provider:Norgate Data (referral link)


Visited 169 times, 2 visit(s) today

Click Here to Leave a Comment Below

Jacopo - December 5, 2013 Reply

Hello,

could you share the Amibroker code for the rotational system you just posted.

Thank you

Pete - December 6, 2013 Reply

Which program did you use for backtest? Is possible to see code?
Thank you

    Cesar Alvarez - December 6, 2013 Reply

    I use AmiBroker for my backtesting. Sharing the code really does one no good without the data. I cannot share the data because of the license agreement with the data provider. Sorry.

Andy - December 8, 2013 Reply

I’m wondering if implementing a stop-loss that would allow the strategy to exit losing positions mid-month would have helped the performance of the Worst portfolio when it got smacked (technical term) in 2008.

Stop Losses and Equity Curves » Alvarez Quant Trading - December 16, 2013 Reply

[…] « Monthly S&P500 Stock Rotation Strategy […]

Andreas - December 18, 2013 Reply

The equity curves and the backtests look quite attractive. However, I am wondering whether your backtest also takes into account the survivorship bias? If you do the backtest using the current 500 index shares, your results will be flawed. Did you use the historic index composition?

    Cesar Alvarez - December 18, 2013 Reply

    Yes, the data accounts for survivorship bias and use the historical index composition. See the FAQ for more details.

VL - July 11, 2014 Reply

Hi,

I’m considering doing some backtests within the universe of SP500 via Amibroker. I used to use Watchlist to define the universe of securities for selections during the backtest. But it appears to me a watchlist of 500 stocks may be way too many for Amibroker.

Is my concern valid ? Are you using different architecture or configurations in Amiborker for your backtest via SP500 stocks ?

Your suggesions/comments are greatly appreciated !!

Thanks !!

VL

    Cesar Alvarez - July 11, 2014 Reply

    A watch list of 500 for AmiBroker is tiny. I have used watch lists of 13,000 before. The bigger question for me is that you make sure you use as the SP500 existed stocks. Using the current stocks in the index as your testing universe greatly biases your results to the positive as my post on this subject showed.

Marco - September 25, 2014 Reply

If this rotation system worked without 200 ma filter, it would simply be great!
http://nightlypatterns.wordpress.com

Thomas Musselman - February 15, 2017 Reply

I tested w/o market timing rule, and tested an average of all possible start dates, and the best 20 by your lagged 1 year return rule doubled the CAGR of the bottom 20 from March 1, 1957 forward, hold 20 trading days. And both underperformed simply holding SPY.

So the first of the month start day may be cherry-picked rather than meaningful.

    Cesar Alvarez - February 15, 2017 Reply

    It is a known edge that trading on the first day of the month is good. If one tests all the days of the month, one tends to find that the last few days and the first few days of the month have the best results.

prashant bajpayee - December 2, 2021 Reply

Hi Cesar
Thanks for sharing this. What happens if you sell only stocks which goes out of top list and keep the stocks which remain in top ranked, next month?

    Cesar Alvarez - December 2, 2021 Reply

    I did not test that. Something to add to my very long testing list.

Leave a Reply: