How much does not having survivorship free data change test results?

Over the last month several people have asked me how important it is to have survivorship-free data. For any researcher this is an important question to understand how the different data can change your results. We will be exploring three potential data issues: as traded prices, delisted stocks (survivorship-bias), and historical index constituents (pre-inclusion bias).

My data source is CSI Data, which includes delisted stocks and as traded prices. Unfortunately they are no longer selling this package to individuals. Norgate Data supplies delisted stocks and as-traded pricing. I have not used them before. I welcome comments from people that have on the quality of their data and customer service.

General Information

For the system used for ‘As Traded’ and ‘Delisted’ tests, entry and exit is on the open, maximum of 10 positions and signals are rank from high to low by 100 day historical volatility. Test results are from 1/1/2004 to 12/31/2013.

As Traded Prices

Setup

  • The 21 day Moving Average of Close*Volume is greater than $(5,15) Million
  • RSI(2) is less than 5
  • Close down three or more days in a row
  • 100 day Historical Volatility is greater than 40
  • Close greater than 200 day Moving Average(tested with and without this rule)
  • (As-trade price, adjusted-price) greater than $5
  • Using delisted stocks
  • Previous day is a setup, place a limit order 5% below previous day’s close
  • Close greater than 5 day Moving Average

Buy

  • Previous day is a setup, place a limit order 5% below previous day’s close

Sell

  • Close greater than 5 day Moving Average

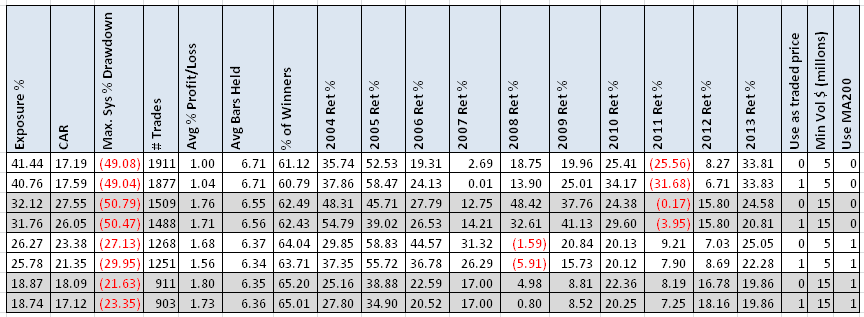
As traded price is the actual price a stock traded on a particular day before splits, dividends, and one-time dividends. For example, you may have a rule that you do not trade stocks under $10. If you ran a test back to 1996, after splits and dividend adjustment MSFT price is around $7. MSFT was actually trading at around $150.One would skip this stock if they did not have as-traded pricing.


140218A

(Click on image for larger version)

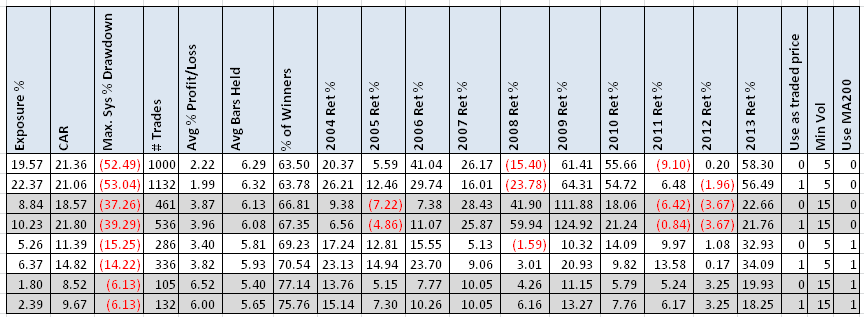
I had never run this test before and these results surprised me. Overall there is no significant difference in using as-traded price vs. adjusted price. The following tests using prices between $1 and $5.

140218B

(Click on image for larger version)

Again there is no significant difference in using as-traded price vs. adjusted price.


Delisted Stocks (Survivorship Bias)

Setup

  • The 21 day Moving Average of Close*Volume is greater than $(5,15) Million
  • RSI(2) is less than 5
  • Close down three or more days in a row
  • 100 day Historical Volatility is greater than 40
  • Close greater than 200 day Moving Average(tested with and without this rule)
  • As-trade price greater than $5
  • With and without delisted stocks
  • Previous day is a setup, place an limit order 5% below previous day’s close
  • Close greater than 5 day Moving Average

Buy

  • Previous day is a setup, place an limit order 5% below previous day’s close

Sell

  • Close greater than 5 day Moving Average

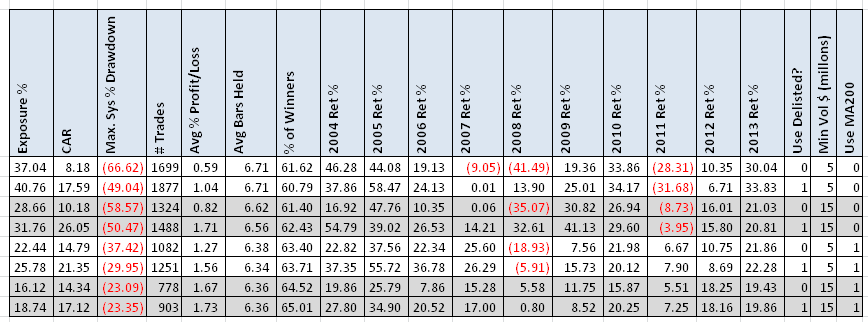
140218C

(Click on image for larger version)

I did this test about 8 years ago with similar results. For this mean reversion system, adding the delisted stocks improves the results. The improvement without the 200 day moving rule is huge. Now can we generalize that all mean reversion systems will get better with delisted stocks, no.

Trend Following System

140218D

(Click on image for larger version)

For this trend-following system (I cannot share the rules), the results got worse. CAR went down, MDD goes up and Avg %p/l drops dramatically. Not using survivorship free data would hurt you in this case.

Historical Index Constituents (Pre-inclusion Bias)

Pre-inclusion bias is using today’s index constituents as your trading universe and assuming these stocks were always in the index during your testing period. For example if one were testing back to 2004, GOOG did not enter the S&P500 index until early 2006 at a price of $390. But your testing could potentially trade GOOG during the huge rise from $100 to $300.

Rules

  • It is the first trading day of the month
  • Stock is member of the S&P500 (on trading date vs as of today)
  • S&P500 closes above its 200 day moving average (with and without this rule)
  • Rank stocks by their six month returns
  • Buy the 10 best performing stocks at the close

140218E

(Click on image for larger version)

People often write about systems they have developed using the current Nasdaq 100 or S&P500 stocks and have tested back for 5 to 10 years. Looking at this table shows that one should completely ignore those results. The difference between the two results is scary. Using the current list would make one think that they had a great system but actuality it was much worse.

Final Thoughts

Good data is important. We have lots of landmines to avoid when testing but avoiding survivorship bias and pre-inclusion bias is easy to do. If you test on a stock universe, buy the delisted stock data.

Spreadsheet

If you’re interested in a spreadsheet of my testing results, enter your information below, and I will send you a link to the spreadsheet. The spreadsheet contains more variations I tested along with yearly returns. Any suggestions what additional items you would like to see in these spreadsheets?

Backtesting platform used: AmiBroker. Data provider:Norgate Data (referral link)


Visited 57 times, 1 visit(s) today

Click Here to Leave a Comment Below

Matt - February 18, 2014 Reply

In addition to the “As Traded” test, it would be interesting to see the results when running against a price database that is completely unadjusted for splits and dividends. This will affect all of your filters (HV, RSI, MA, etc) that are based on price, and will therefore likely have a more significant impact on the results.

    Cesar Alvarez - February 18, 2014 Reply

    I understand testing without dividend. My guess is for mean-reversion systems it would have minimal impact. But why without splits? I don’t think anyone tests that way.

    mhp - February 19, 2014 Reply

    The idea is that your backtesting should model what your daily trading process would be. So if you were looking at a stock today that split 2 days ago, you’d compute all your averages and indicators using split-adjusted prices as of today. You would never, for example, say that a 4-day average was 75 for a stock that traded at 100 for 2 days, then split and traded at 50 for 2 days. But if, for instance, you only trade stocks priced between $10-$80, your model should exclude that stock pre-split and include it post-split. As-traded volume is also important if you use a minimum liquidity level measured in shares rather than dollars. In other words, I’d define “as traded” as “split and dividend adjusted up to the date currently being tested in the model”.

Thomas Musselman - February 18, 2014 Reply

Larry Connors touts price< SMA(5 day) rather than greater than, for short term (5 day) holds.

Did you test that way, too?

    Cesar Alvarez - February 18, 2014 Reply

    For long mean reversion systems, Larry Connors and I used Close greater than 5 Day simple moving average. In AmiBroker code that is Close > MA(Close, 5)

Fred - February 18, 2014 Reply

For all us traders, this is a very important topic and I’m glad you wrote about it. All the findings are important but the index inclusion results are fascinating.

Darren - February 18, 2014 Reply

What does the “Use MT” stand for?

    Cesar Alvarez - February 18, 2014 Reply

    ‘MT’ stand for ‘Market Timing.’ A 1 means that are suing the market timing rule. A 0 means we are not using it.

The Impact of Survivorship Bias on Trading Strategy Backtest Results | The Systematic Trader - February 18, 2014 Reply

[…] the securities traded, etc. For an insight into the impact of survivorship bias I suggest you read this article by Cesar […]

Mike Anderson - February 18, 2014 Reply

I’m guessing MT means Use MA200 or not use MA200 rule.

I’m also wondering about the case for Historical Index Constituents strategy when you are using the MA200 rule and you’ve purchased the top 10 stocks one month because the S&P500 is above MA200, but the next month it’s below – what do you do with the 10 stocks you are holding – keep holding them until the index goes back above MA200 and you get a new list of 10 stocks, or do you sell the 10 stocks you are holding?

Great analysis BTW! No one thinks about survivorship bias when doing back testing.

    Cesar Alvarez - February 18, 2014 Reply

    MT stands for ‘Market Timing.’ If 1 then want Close of SP500 > MA200 of SP500. Zero means we do not use this rule.

    If on the rotation day the SP500 is below its MA200, you exit all positions.

mhp - February 19, 2014 Reply

For my own testing and trading, I use data from NxCore. This is as-traded tick-level data, from which you can build any bar size you want, with and/or without splits and dividends. You do have to be a programmer to use it, as it is only accessible via C++ API. The data consists of a “tape” file for each market day, with all the symbols and trades as reported by the exchanges that day — in other words, raw data. Collating this into per-symbol time series is an interesting challenge. I’ve also heard good things about Norgate from several people, but haven’t used it myself.

MachineGhost - February 19, 2014 Reply

Norgate does not adjust its ETFs or stocks for regular dividends, so all the little gaps will affect price indicators and total return in backtests, so I don’t think the data has any use in realistic backtesting, no matter how clean and accurate it all is. Fanboys are either ignorant of this fact or choose to ignore the problem. Norgate has been working on bringing regular dividend adjusted data out for years (literally), so until that finally happens, it is hard to see what the big deal is. So as much as CSI [via Yahoo] sucks in many respects compared to Norgate, the former does offer what no other data provider does: dividend adjusted data.

    Cesar Alvarez - February 19, 2014 Reply

    That is interesting to hear. I thought they did adjust the data for regular dividends. Looking at their site, it does not mention it. It only mentions “adjusting historical prices for the effect of stock splits, capital returns, de-mergers etc (capital-base adjustments).”

      Ronen - June 26, 2014 Reply

      Hi Cesar,

      Did you eventually decide on going with Norgate and if so, did you notice large discrepancies between their data and CSI’s for the date range that they overlapped?

        Cesar Alvarez - June 26, 2014 Reply

        Yes, I did go with Norgate. The data between Norgate and CSI ended up being pretty close to similar. I would recommend Norgate.

Bing - March 7, 2014 Reply

There are significant risks associated with using the current index constituents to back test long systems, especially over long periods of time, as your testing as shown. However, using current index constituents to backtest short systems are actually beneficial because they tend to understate performance, a kind of “survivalship bias” in reverse.

    Cesar Alvarez - March 7, 2014 Reply

    I still it is risky to use the current index constituents on a short strategy. It may understate returns but it would probably understate drawdowns.

jose - April 27, 2014 Reply

During 2010 I did several long-only backtest studies (inc brokerage and slippage) which showed that survivorship and pre-inclusion biases shifted returns on S&P 500 constituents by approx 7% pa over 10 years. Used Premium data (Norgate), but added divs manually.

Robert - June 28, 2015 Reply

Very interesting results! Thanks for sharing.

Given a quality database, such as could be Norgate with delisted stocks, how many years of data would you recomend to properly test a mean reversion stategy?

    Cesar Alvarez - June 28, 2015 Reply

    I like to start from 10 years back. It covers all kinds of market environments.

    Cesar

Colman - September 14, 2015 Reply

Did your trend following system include a stop loss? If not does adding one remove the difference in performance between survivor/ no survivor data

    Cesar Alvarez - September 15, 2015 Reply

    It does not have a stop in the traditional sense. I would not expect adding the a stop to change the results.

Leave a Reply: