- in ETFs , Trend Following by Cesar Alvarez
Heikin-Ashi Charts
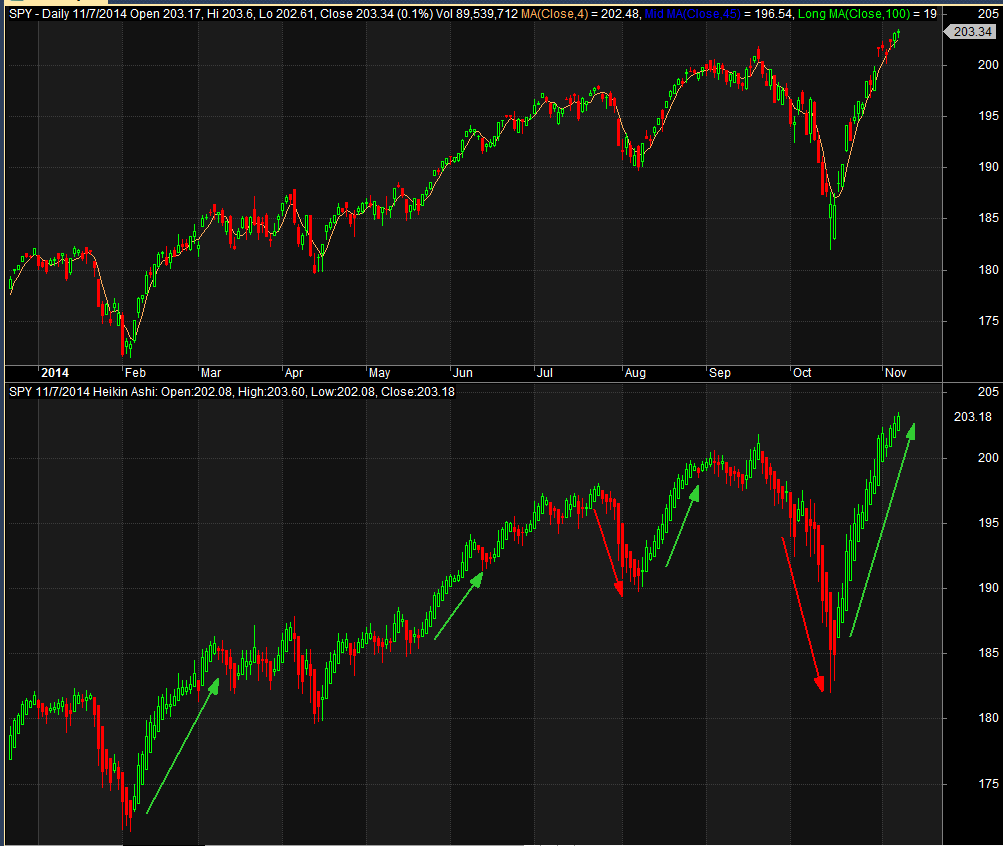
A reader recently introduced me to Heikin-Ashi charts. Popular with forex traders for showing trends which at first look of chart sure seems that way. Look at these two daily charts. The top one is a standard Candlestick chart while the bottom is Heikin-Ashi chart.
The trend of unbroken green sure seems more obvious and stronger in the Heikin-Ashi chart. Will testing confirm this?
Explanation of Heikin-Ashi
Stockcharts.com has a good explanation of Heikin-Ashi charts and the calculation.
Heikin-Ashi Candlesticks are an offshoot from Japanese candlesticks. Heikin-Ashi Candlesticks use the open-close data from the prior period and the open-high-low-close data from the current period to create a combo candlestick. The resulting candlestick filters out some noise in an effort to better capture the trend. … Heikin-Ashi Candlesticks are not used like normal candlesticks. … Instead, these candlesticks can be used to identify trending periods, potential reversal points and classic technical analysis patterns.
Testing Details
For these tests, the focus is on ETFs, for a change, with the testing dates from 1/1/2006 to 6/30/2014.
Daily Timeframe
Searching around, one common way to use Heikin-Ashi is by pairing it with MACD indicator. I tried several parameters and rules with MACD but could not come with anything that produced interesting numbers. Another indicator I saw paired with Heikin-Ashi is stochastics. Again everything I tried here did not lead to any interesting numbers.
Monthly Timeframe
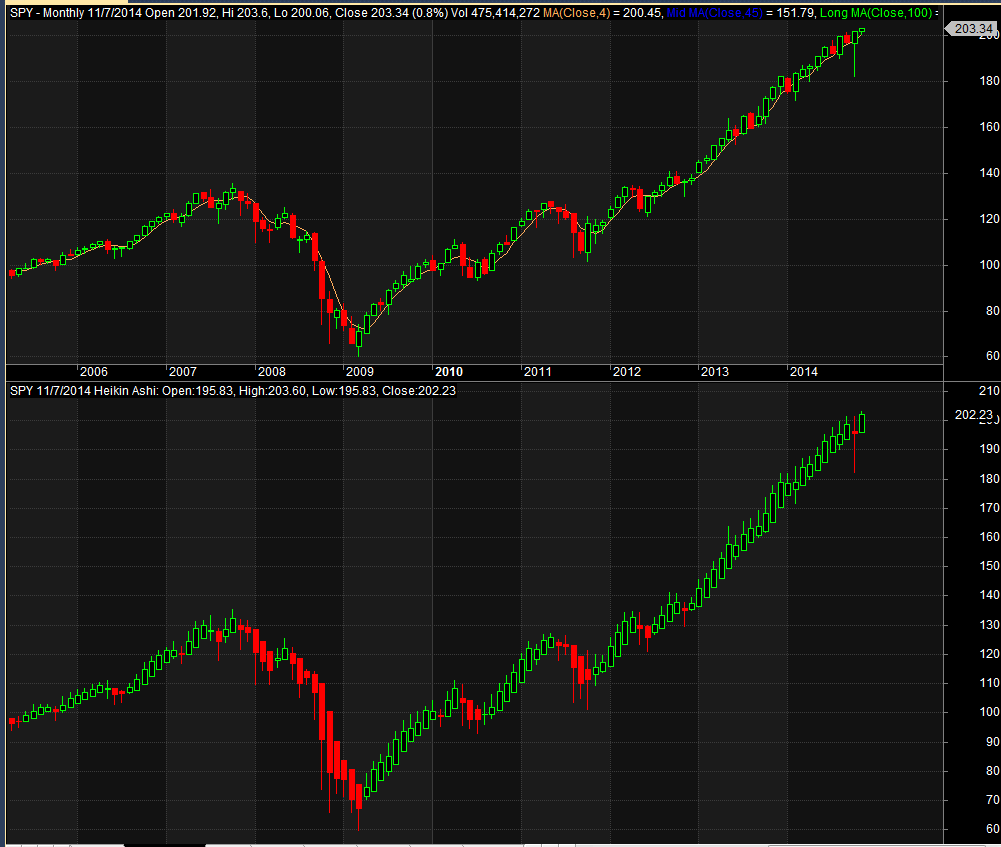
Looking at a monthly timeframe on the SPY, the trends seem even more pronounced.
Time to test a simple strategy.
Heikin-Ashi Rules
Buy Rules
- If the close of the monthly bar is green (Close greater than Open)
- Enter on the open of the next monthly bar
Sell Rule
- If the close of the monthly bar is red (Close less than Open)
- Exit on the open of the next monthly bar
MA200 Rules (used for comparison)
Buy Rules
- If the close of daily bar is above the 200 day moving average
- Buy on the next day’s open
Sell Rule
- If the close of daily bar is below the 200 day moving average
- Sell on the next day’s open
Results
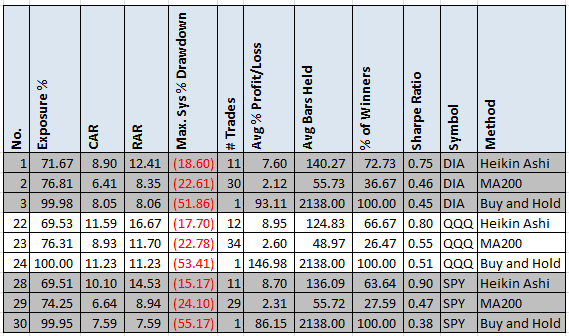
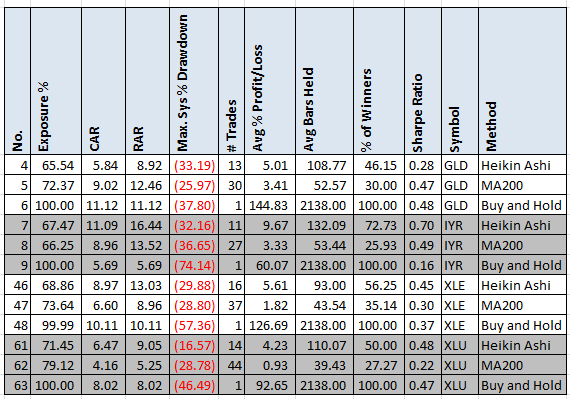
For comparison I have added the results of ‘Buy and Hold’ and MA200 strategy from above. The reason to compare against MA200 is that what I use frequently as a long term trend indicator for my mean reverse strategies. Could Heikin-Ashi be a better long term trend indicator?
DIA, SPY, QQQ
The Heikin-Ashi strategy outperforms the MA200 and Buy and Hold in all cases looking at all the metrics. Very impressive.
GLD, IYR, XLE, XLU
This is interesting. I was expecting Heikin-Ashi to shine on GLD but that is the one it did the worst with. For the other ETFs, it gave the best results.
Using monthly data on Heikin-Ashi seemed to be the trick on producing good results. Trying the same rules on daily data produced breakeven numbers at best. Not sure what I need to add to the rules to generate better results on daily data. I don’t like using monthly data when trading my daily strategies.
Spreadsheet
Fill the form below for a spreadsheet of results. In the spreadsheet I have included yearly results. Results from the following ETFS: GLD, IPE, IYR, KBE, KCE, KIE, KRE, TLT, XBI, XES, XHB, XLB, XLE, XLF, XLI, XLK, XLP, XLU, XLV, XLY, XME, XOP, XPH, XRT, XSD, SH, SDS, SPY, DIA, QQQ are also included.
Also included is the code in AmiBroker to produce Heikin-Ashi charts.
Final Thoughts
Have you used Heikin-Ashi charts on stocks? If so, how? It looks like there is something here that can be used for stocks but I need to keep searching. Any ideas to what to try next?
Backtesting platform used: AmiBroker. Data provider:Norgate Data (referral link)
Good quant trading,


