XIV a heart attack waiting to happen

A research friend recently sent me a link to The #1 Stock In The World. Besides being a blatant title to get one’s attention (and it worked on me), I found the idea interesting along with my research friends. I have been trying to add either XIV or VXX to my trading in some small way. The article is only doing a buy and hold on XIV but it peaked my interest to try some other ideas.

Major Data Problem

Here is where I ran into problem right away. XIV did not trade until 11/30/2010. So it has had the benefit of a long bull run with declining volatility. Exactly the market that one would expect it to do well in. A little searching around and I found Six Figure Investing which has synthetic data back to 2004 for XIV. After purchasing the data, a comparison of the daily return of the XIV-Synthetic vs XIV from 2011 to 2014 has a correlation of 0.999+. Not too bad. I normally do not like using synthetic data because even with high correlation, individual days can vary dramatically. Since I was going to be testing longer holds, this should be less of an issue.

Buy and Hold

The article claims that XIV is a great buy and hold. Let us looking at some numbers.

150708A

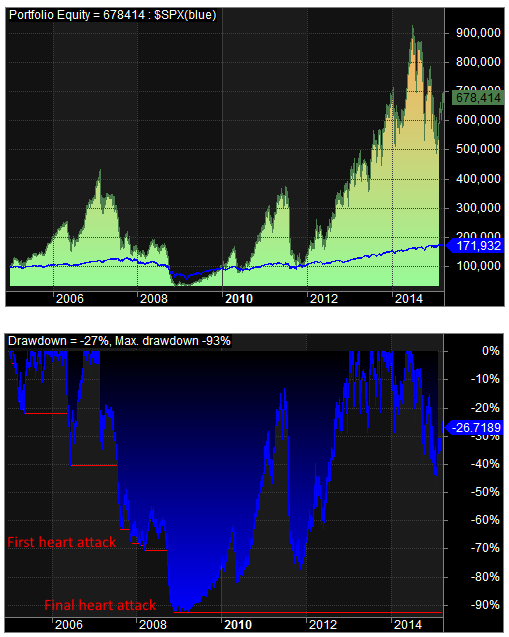
To put the returns and drawdowns into better perspective here are some charts.

150708b

Several triple digit years. That gets my attention. The CAR is good but those drawdowns! The worst one is 92%. No one can handle that. I have a friend of mine that regularly handles 50-60% drawdowns but I am sure this one he could not. What is amazing is that it made it back up.

Another major point about the 92% drawdown is that the ETN may have closed down. If you read the prospectus, you will see language that says they may close down the ETN if large losses are incurred. Well that sure seems large to me. Would you got your money back or lost it all? Would they then reopen it so you would have chance to make it all back?

What next?

Clearly buy and hold of XIV was not going to happen. The question is can we tame the drawdowns somehow and still get some good returns. I am looking for max drawdown in the 30-40 range and will see what kind of CAR that produces. The first thoughts I had was not allocating 100% of my capital to XIV but keep cash around.

Base rules

Test range from 1/1/2005 to 3/31/2015. From 1/1/2005 to 1/1/2011 we use the synthetic data and then after that we use XIV data. Entry and exit on the close of the rotation period. Tested rotation periods are weekly, monthly, quarterly and yearly. No commissions or interest on cash.

Idea 1: Percent in XIV

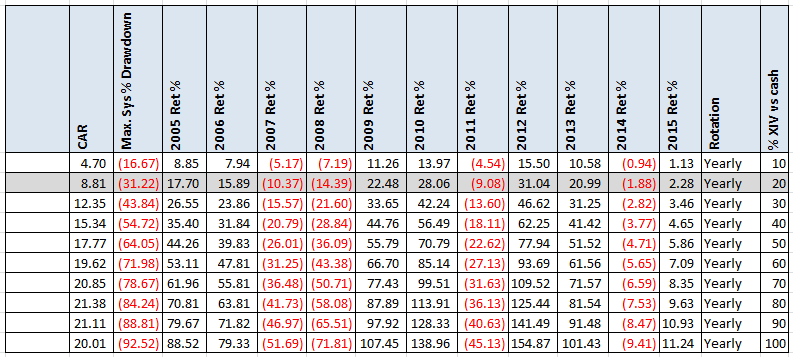
The first idea is one I read about when trading a volatile strategy that can generate high returns but with large drawdowns. What we will do is only invest X% of the portfolio value in XIV. Then at the rotation period we will rebalance to get back to this percent. Typically this value is said to be 10% or 20%.

Yearly rebalance

150708c

At 20% in XIV, we have a CAR of only 8.8%. Not that great given the MDD is 31%. Maybe a different rebalance period?

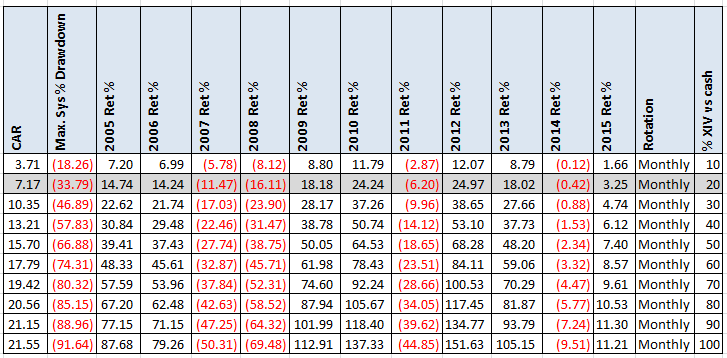
Monthly rebalance

150708d

Little change. On do different ideas.

Idea 2: Use RSI to determine percentage

The idea here is to be more allocated in XIV when is doing well and less when it is not. A simple what to test this is to use RSI. The RSI value will determine the percent we will invest in XIV for the rotation period. For weekly rotation, we will use weekly RSI. For the other rotation periods we will use monthly RSI. We will test various lengths for RSI.

Weekly rebalance with RSI

150708e

Nothing good here.

Monthly rebalance with RSI

150708f

Again nothing good.

Idea 3: Number of recent highs

The next idea comes from the researchers I was working with while exploring this. The general idea is counting how new highs have been made over the last N days and then ranking that value with all the other values in the last M days. Basically the less new highs you have made and the worse it is compared to the others, the more you invest. Think of this as a mean reversion of volatility. The opposite of idea 2.

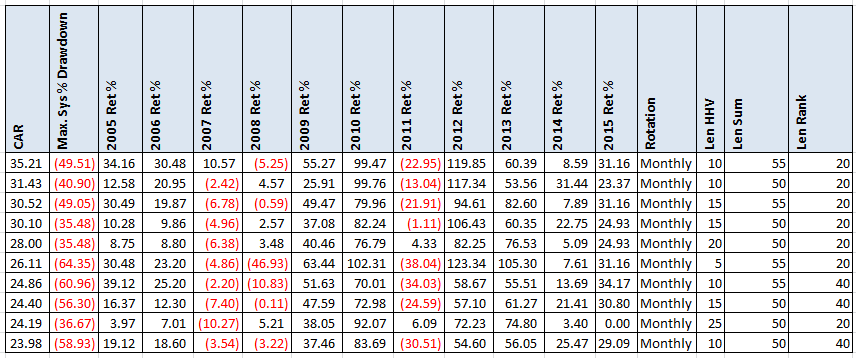
The AmiBroker code is “pct = PercentRank(Sum(Close<HHV(Close,lenHHV),lenSum),lenRank); .“

150708g

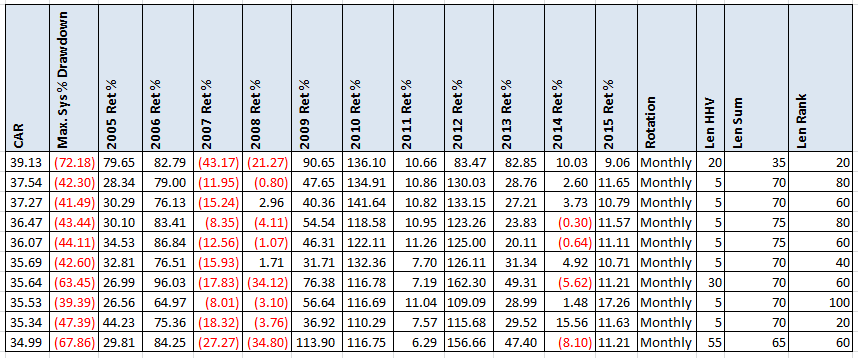
At this point I was becoming annoyed of lack of results and threw the optimizer at it and ran 18,000 variations. These are the results of the top 10 by CAR for a monthly rotation. Still huge drawdowns. The only good part is that 2008 is no longer bad.

Sometimes the opposite idea generates good numbers. I took the value from above and subtracted it from 100.

150708h

These had higher CAR, which at least confirms that you should ride the trend but those pesky drawdowns.

Just a leveraged SPY?

At this point I wondered if this was just a leveraged SPY strategy. The correlation between the SPY and XIV is .83 which is high.

150708i

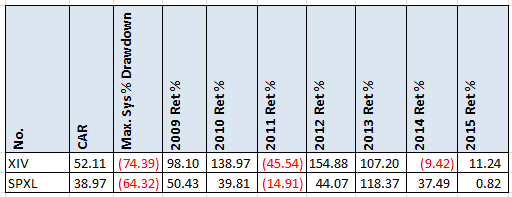
Above is the comparison of Buy and Hold of XIV and SPXL (3x SPY). Even though the correlation is high the yearly returns can be very different.

Spreadsheet

Fill the form below to get the spreadsheet with lots of additional information. This includes yearly breakdown, worst 5 drawdowns and additional statistics.

Final Thoughts

When I got to near the end of this research, I discovered this article XIV And High-Beta Investments In Bull Markets. He compares XIV to a 3.4x SPY. In the end, I believe there is enough difference between SPXL and XIV to still look for something in XIV. The problem is dealing with the drawdowns. Even though I am willing to go up to 40%, I could not find any returns that felt compelling. Maybe only trading during certain markets? Got ideas? Add them to the comments and if I get enough interesting ones, I will do another post. Or any ideas to try on VXX?

As always, test what you read. Even though the original author may believe it may be a great trade, one needs to know what one is getting into. Like a 92% drawdown.

Backtesting platform used: AmiBroker. Data provider:Norgate Data (referral link)

Good quant trading,

Fill in for free spreadsheet:

spreadsheeticon

 
Visited 61 times, 1 visit(s) today

Click Here to Leave a Comment Below

Nat - July 8, 2015 Reply

You are correct. That SA author is leading the sheep to the slaughter. It’s sad.

Jim Carroll - July 8, 2015 Reply

Cesar – There are some interesting ways to use XIV and VXX out there. They generally take signals from the volatility term structure rather than the price of the ETN. You might want to look at VolatilityMadeSimple.com. They have tested a wide range of strategies. Also a good paper by Tony Cooper available on his web site http://ddnum.com/articles/index.php

    Cesar Alvarez - July 8, 2015 Reply

    Thanks, I will have to take a look.

Bitfool - July 8, 2015 Reply

To the SA article author’s credit, he is quite explicit that these drawdowns make XIV a high risk vehicle, and points out that despite this being his “favorite”, he has only a couple percent of his personal portfolio invested long in XIV. A total crash and close of the fund would not slaughter sheep that followed his advice in that regard. Hardly sad for those who take such risks with a risk-appropriate portion of their funds. I would reserve sadness for those who don’t read the whole article, who listen to only what they want to hear, who don’t do due diligence for their investing. Plenty of sadness without pinning blame on this author for bringing wider attention to an important volatility ETP.

    Cesar Alvarez - July 8, 2015 Reply

    I agree that he makes it clear that there are high DDs. But they are much worse when using the synthetic data to go back. People do get easily sucked in by high returns without regard to risk. Even risking only 5% of one’s account, one still needs to understand the full risk. What I like most about his article is it forced me to take a look at XIV and start thinking about.

dph - July 8, 2015 Reply

Cesar,

Have you written any blogs on extreme systems where the juice is worth the squeeze (ie 40%-90% drawdowns)? I allocate small amounts to volatility and leverage based systems but would like to hear more about what type of CAR would be worth these risks – from your perspective.

    Cesar Alvarez - July 8, 2015 Reply

    I have not written anything along those lines. That was the hope with this article but I did not get enough return for those drawdowns.

    Cesar Alvarez - July 8, 2015 Reply

    Thanks. I will have to take a look. Too much info on the internet to see it all. I am glad for all the responses pointing me to Volatility research.

Nat - July 8, 2015 Reply

My statement was not a value judgement, it was a prediction.

Quantocracy's Daily Wrap for 07/08/2015 | Quantocracy - July 8, 2015 Reply

[…] XIV a heart attack waiting to happen [Alvarez Quant Trading] A research friend recently sent me a link to The #1 Stock In The World. Besides being a blatant title to get ones attention (and it worked on me), I found the idea interesting along with my research friends. I have been trying to add either XIV or VXX to my trading in some small way. The article is only doing a buy and hold on XIV but it peaked my interest to try some other ideas. […]

Alex Argyros - July 9, 2015 Reply

A very simple approach, but one that really cuts down on drawdowns, is that championed by Marc Jolicoeur: http://seekingalpha.com/user/70713/instablog.

XIV — IMHO interesting long-term value idea | Quantitative Investor Blog - July 9, 2015 Reply

[…] 2: more research on synthetic data. As one could predict, B&H drawdown is 92%, but CAGR still about 20% […]

Rob - July 10, 2015 Reply

XIV is one of my primary trading vehicles, incorporated into a portfolio with SPX option spreads. All the comments about studying the term structure are spot on and critical to trading this and all volatility ETPs. I’ve done a lot of research and backtesting on XIV and maybe the best shortcut I can give you is to find a ‘get the F out’ signal to avoid the larger drawdowns. A simple one to use is to find a level of VIX / VXV (1 month volatility / 3 month volatility) where you exit the trade. If you go back and review the data (I also bought the six figure data) you will find that the worst drawdowns all occurred when the ratio above was trading at higher levels and the volatility term structure was in backwardation, as opposed to the usual contango state which provides the tailwind during the good times.

A similar vehicle that has much better risk/reward metrics but moves much more slowly is its cousin ZIV which focuses on the mid-term VIX futures (4 to 7 months out). It takes a very aggressive and prolonged market downturn to tip these futures in the outer months into backwardation so it is a bit of a safer bet. Volume and spreads are less than ideal though so low-frequency strategies would be ideal.

Bitfool - July 11, 2015 Reply

@Nat: fair enough. perhaps write your predictions as such next time to save bandwidth for both of us.

Rob - July 13, 2015 Reply

You write “Even though I am willing to go up to 40%” that is a lot even for a single strategy. What is the max portfolio drawdown you are willing to accept?

    Cesar Alvarez - July 13, 2015 Reply

    It all depends on context. For this particular post I was looking for annual returns greater than MDD.

matt haines - July 23, 2015 Reply

Hi Cesar. I was wondering if you tried something as simple/old-school/boring as moving averages or momentum tests? I just did a quick test in Amibroker on XIV data (since I don’t have the synthetic data) showed a momentum test with a lookback of 20 days improved CAR/MDD, reduced the drawdown to 1/3 of buy-and-hold, at the expense of reduced profits as well. But i haven’t taken it any further than that.

Funny that we’re all looking at a high volatility instrument and saying to ourselves, “Now how can we reduce the volatility…?” 🙂

    Cesar Alvarez - July 23, 2015 Reply

    Yes, I have tried MA and did not get anything I liked. I agree that is funny that we start with something with high Vol and then try and reduce it.

XIV a heart attack waiting to happen | SAMUELSSONS RAPPORT - July 30, 2015 Reply

[…] Källa: XIV a heart attack waiting to happen | Alvarez Quant Trading […]

Jason Adrian - April 13, 2016 Reply

I would think that any strategy should take into account the roll yield from the underlying contracts the ETN references. RSI + good roll yield might be very helpful. Negative roll yield should trigger a sell of the position until the next assessment period.

    Cesar Alvarez - April 13, 2016 Reply

    You are probably right but I wanted to see how the described strategy did first.

Shah - July 1, 2016 Reply

I’m currently using Renko charts with around a 15 cent box and 10 period EMA with good results.
If a second box is built above or below EMA I switch directions (Long vs short). I also don’t hold over weekends due to unknowns, especially from overseas markets.

Yes it requires daily monitoring (or setting alerts) to make sure I’m going with the flow. And sure I’m gonna spend more on commissions but that’s worth it in my opinion.

Your thought?

    Cesar Alvarez - July 5, 2016 Reply

    I am not a day trading so it it is hard for me to make any useful comments. Sorry

Hoser - October 3, 2016 Reply

Since XIV “always comes back unless it goes to zero” it seems a strategy where you buy more when it goes down, and either sell or hold if it goes up might be in order. You wouldn’t avoid the drawdowns but you would participate in the recoveries.

    Cesar Alvarez - October 3, 2016 Reply

    That is a possible way to trade it. But one needs to ready for the possibility of it going to zero overnight.

Leave a Reply: