- in Mean Reversion , Research , Stocks by Cesar Alvarez
ConnorsRSI Strategy: Optimization Selection
In the previous post, Simple ConnorsRSI Strategy on S&P500 Stocks, I showed a simple strategy which I optimized which gave 1,300 variations. Today, I will cover various methods to choose a strategy to potentially trade.
Goals
The goals were to find a variation with over 20% CAR and Max Drawdown under 25%. Know ahead of time what metrics you care about and what values you want is important. Maybe you care about Ulcer Index or Sharpe Ratio or correlation with SPX. Everyone has their own but you must figure out what yours are. I like to keep it simple and use CAR and MDD because at the end of the trading year this is what I am focused on most.
The output for these optimization runs were produced using AmiBroker. You can find more information about it on my site here.
Method 1: Best CAR
The most obvious method is to simply sort by one my metrics and pick the first variation that meets my criteria. For novice researchers, this is what they gravitate to.
The numbers great. A CAR way above my threshold and a MDD way below it. What could be wrong with this? Variations near the top are likely there because of luck. Small changes in the parameters may have large change in the results. The next post will be on this topic.
Method 2: Avoiding top and low Ulcer Index preference
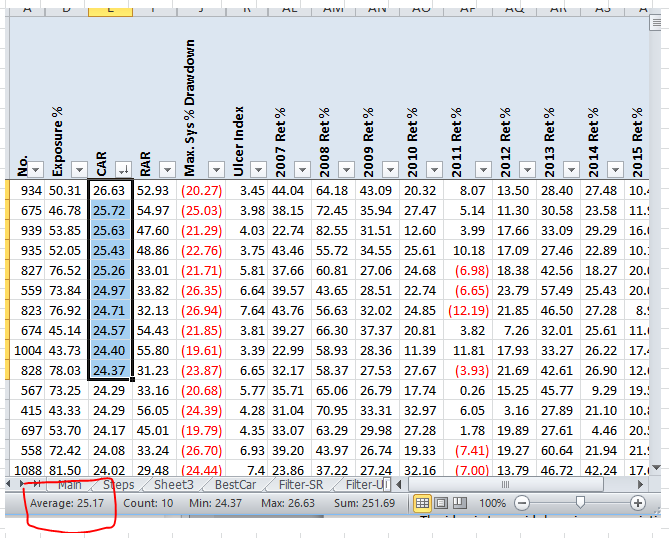
To avoid picking a variation near the top, I do the following. First I sort by CAR. Then I take the average of the top 10 CAR (25.17) and multiply by .9, which give us 22.7.
Why .9 and 10? This is a personal choice. The idea is to avoid choosing any variations near the top. You can change these values to suit yourself or choose a different method.
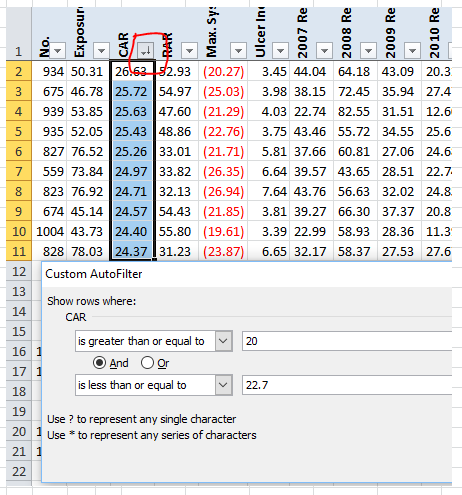
Now I filter my results to show only CAR > 20 and less than 22.7.
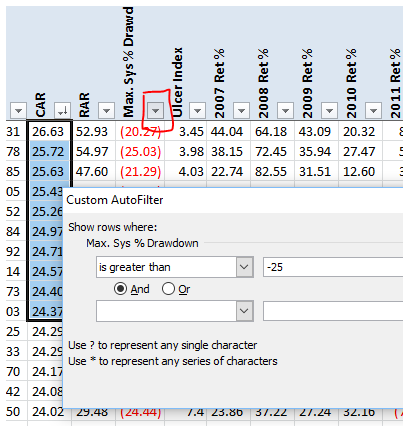
This leaves us with 264 variations. Next I filter the results to show only those with MDD less than 25, which gives us 178 variations.
This is a good sign when lots of variations pass my goals and are not near the top. But how do I select from these 178?
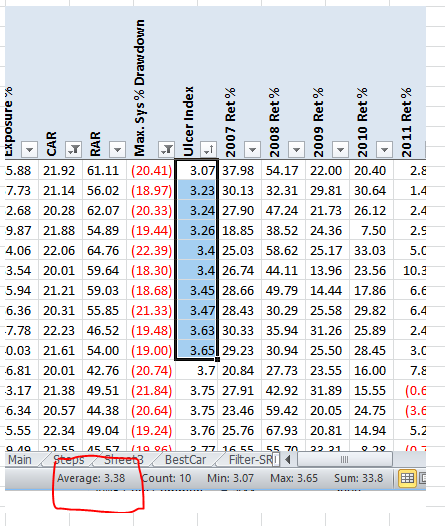
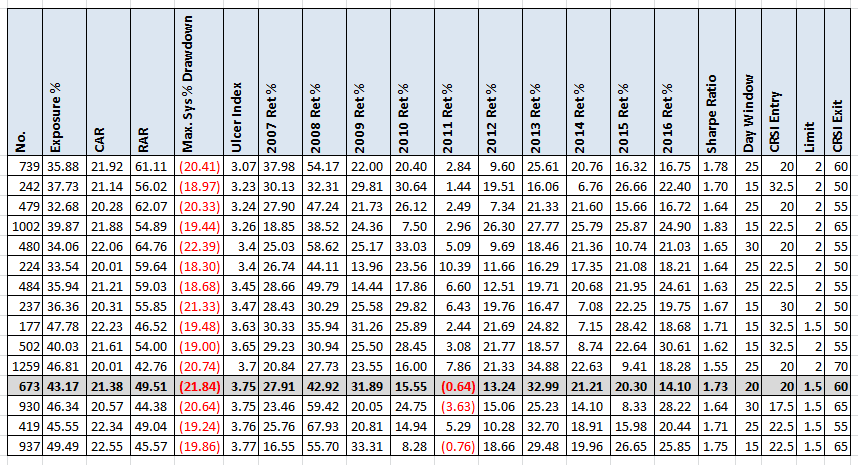
Next I sort by Ulcer Index. The average of the 10 lowest is 3.38 and 10% more is 3.72.
In this case I look for the first variation that looks “good” with an Ulcer Index greater than 3.72.
The highlighted row is what I chose. No real good reason just seemed good. Again it is a good sign when you have a hard time picking the variation. You may notice that the CAR is significantly lower than the highest CAR. But it exceeds my goal.
Method 3: Avoiding top and using histogram
This is the method I use most frequently. This works best when lots of variations look good. The idea is to filter the results down to 100-200 variations. One could use the previous method and stop when we got to 168 variations. This time I will change the steps slightly to show another way of filtering. I start the same as the previous method. I sort by CAR. I filter the results to show only CAR > 20 and less than 22.7. Now I filter the results to have Ulcer Index less than 6, which gives us 187 results. I like Ulcer Index because it captures both drawdown and draw length.
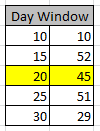
From those 187 variations, I take each parameter and count how often each value shows up. I then pick the value that has the most and has lots of values around it.
Day Window
Of the 187 variations, 52 had a 15 day lookback. But I did not pick this one because the value of 10 had only 10. I like the 20 day value because it is close to the max and there are higher values around it.
CRSI Entry
Here the highest count is 38 and with good counts around it. So I choose 22.5 as the CRSI Entry value.
Limit
The 1.5% value is very close to the highest and has two high values next it.
CRSI Exit
Here both the 60 & 65 CRSI exit values are very close and I could easily pick either one.
Now that I have picked the individual values, I look at the variation with those values. I want to see if it matches my goals. There are times it does not, then I will look at some other values. For example changing the CRSI exit to 65.
We can see with CAR of 21 and a MDD of 20, this variation passes my goals.
Spreadsheet
File the form below to get the spreadsheet with lots of additional information. See the results of all variations from the optimization run. This includes top drawdowns, trade statistics and more. Included is the formula used to count the results.
Final Thoughts
We have chosen three variations. But this is still not good enough. What I want to know next is what happens with parameters near the selected ones. I don’t want my chosen variation to be near a parameter peak. In the next post, I will show how to do parameter sensitivity testing.
Backtesting platform used: AmiBroker. Data provider: Norgate Data (referral link)
5/3/2017 edit: See the follow up post on this, ConnorsRSI Strategy: Sensitivity Analysis.
Good quant trading,

Fill in for free spreadsheet:
![]()


