- in Rotation , Stocks by Cesar Alvarez
My quest to find the best performing S&P 500 stocks after several up days
In the previous post “Which S&P500 stocks to focus on when the SPX has 5 higher closes,” we discovered which stocks (from the S&P 500) produced the best returns when the market closed higher five consecutive days . The results from that work, as often happens, suggested a deeper look; specifically, can those concepts be applied to S&P 500 stocks without having to wait for specific market conditions (e.g. five up days in the SPX)? If so, maybe this is the start of a viable, standalone trading strategy. As indicated, this post builds on the previous post, so please refer as needed.
Baseline
Our research is on S&P 500 stocks from Jan 2001 to Aug 2013. We will focus on the five day return, because that time frame is what looked most promising in the initial research. A look at every S&P 500 stock, every day, and calculating the five day return (close to close), results in the following baseline stats.
Exactly N Up Days
Using the initial rules on individual stocks instead of the SPX might leads us somewhere interesting. Again, the rules will be added one at a time to see how the results are changed by each individual rule change.
Rules
- Buy Rules
- S&P 500 stocks, only
- Close up exactly (2,3,4,5,6,7,8) days in a row
- HV100 greater than 35 (from the last post, we want higher HV100 stocks)
- Sell Rules
- Sell 5 days later (at the close)
The Results
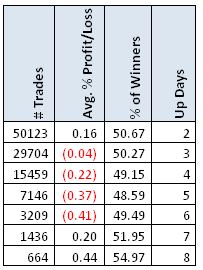
Reversion to the mean is clear in the up 3 to 6 days in a row situations. At 8 days up a row, we have double the baseline performance results but there are only 664 trades, which are too few. We are looking for at least 1,000 trades over this time frame to make this a viable strategy.
Adding Close above the MA200
Rules
- Buy Rules
- In the S&P 500
- Close up exactly (2,3,4,5,6,7,8) days in a row
- Close greater than the MA200
- HV100 greater than 35
- Sell Rules
- Sell 5 days later (at the close)
The Results
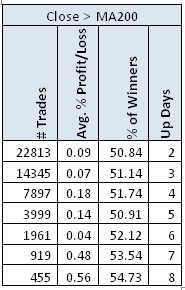
Adding the MA200 increases the results, but not significantly, over the previous run.
Adding that Close is not a 50 day high of closes
Rules
- Buy Rules
- In the S&P 500
- Close up exactly (2,3,4,5,6,7,8) days in a row
- Close greater than the MA200
- Close is not a 50 day high of Closes
- HV100 greater than 35
- Sell Rules
- Sell 5 days later (at the close)
The Results
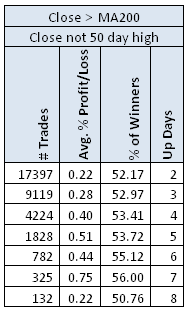
Now things get interesting. In these results at up 4 & 5 days, we have doubled the baseline and still have a nice number of trades. What will it take to get the average gain per trade over 1%?
Market Tailwind
From the previous post, we saw that having the market up strong also helped. But we did not get enough trades. Perhaps there is a weaker tailwind that will give us enough trades and boost returns
Rules
- Buy Rules
- In the S&P 500
- Stock Closes up exactly (2,3,4,5,6,7,8) days in a row
- Close greater than the MA200
- Close is not a 50 day high of Closes
- HV100 greater than 35
- SPX Close Up exactly (2,3) days in a row. SPX does not close at a 50 day high of closes. SPX Close greater than the MA200.
- Sell Rules
- Sell 5 days later (at the close)
The Results
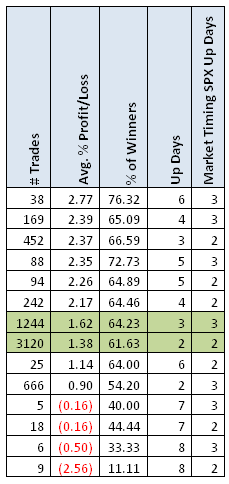
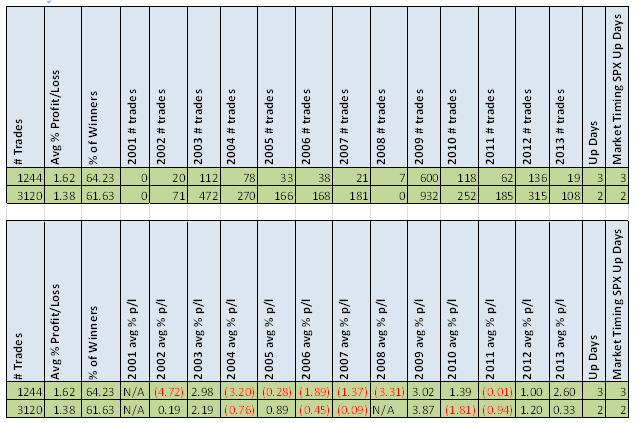
Wow. Looking at the two highlighted rows, there are plenty of trades and a good avg. %p/l. One thing that I find interesting is that the number of up days for the stock matches the number of up days for the SPX. But before getting too excited, let’s drill down a little more and look at the distribution of the results; in other words, let’s take a look at a year by year breakdown of the results.
Yearly Breakdown
Unfortunately, most of trades (and profits) come from two years, 2003 & 2009. Can we find another market timing filter that will improve the other years? I have some great ideas that I will explore in a future post. In the meantime, my search for the ‘Grail’ continues.
Spreadsheet of Results
If you’re interested in a more comprehensive set of my testing results, enter your information below, and I will send you a link to the spreadsheet which I spent several hours creating. The spreadsheet includes test results at different N day highs, above & below the MA200, and more stats than shown.
Backtesting platform used: AmiBroker. Data provider:Norgate Data (referral link)


