- in Research by Cesar Alvarez
Nine days down. How bad is that?
As anyone who pays attention to the market, the S&P500 is down nine days in a row. I had several people write me about this. I was talking to a trading friend over the weekend about this. Nine days down seems bad. Let us put this in a broader context. How far have we come down in those nine days? Only 3.07%. Now that got me thinking is 3.07% in nine days that bad?
Price Action Lab has a post on this, The Nine-Day Losing Streak In S&P 500 Is A Random Pattern. As always, I take a “trust but verify” approach to other’s research and wanted to do some additional analysis.
My S&P500 research will be starting from 1986. Looking at all nine day periods with a negative return we get the following stats. There have been 3,189 times that the index has been down over nine days. The average return has been -2.30%. The current period is worse than average but the standard deviation is 2.51, which means we are not even one standard deviation away, so not that bad.
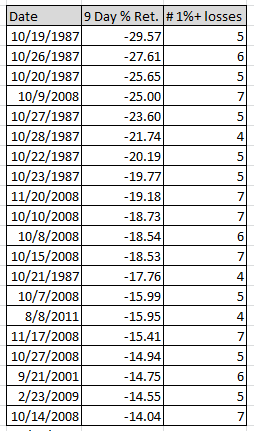
Here we have the top 20 nine day loses. If we were in those top twenty, I would be worried.
The current period of being down 3.07% ranks 788, which means it barely breaks into the top 25% of worse nine day periods.
The current down period has had no 1% or more down days. I wondered how common is that. For the 3,189 down periods the average number of days with 1% or more down is 1.86. Again this period is below average with zero. Looking at the top 788, there has only been 2 times were there were no 1% or more down days. And the average for this top 788 is 3.2 days with 1% or more losses. Again, these nine down days seem tame in comparison.
As everyone is speculating, the markets are nervous about the election because of the uncertainty and markets don’t like uncertainty. Do I like the fact we are down nine days. No because overall the strategies I trade have not liked it. I have no nine days down rule in my strategies or a pre-election rule, so I will keep trading my rules.
Spreadsheet
Fill the form below to get the spreadsheet which contains all the nine down day periods since 1986 with their return and number of 15+ losses.
Backtesting platform used: AmiBroker. Data provider:Norgate Data (referral link)
Good Quant Trading,

Fill in for free spreadsheet:
![]()


