- in Mean Reversion , Research , Stocks by Cesar Alvarez
Internal Bar Strength for Mean Reversion
I’ve been writing this blog for nine years now. Sometimes I am amazed about topics I have not covered and this is one of them. When developing a new strategy, these are the indicators I likely test: RSI, Historical Volatility and Internal Bar Strength (IBS). I had a reader send me an email pointing me to research done on IBS. I thought let me send him my blog post on this. After searching my records and site, I could not find one. That made it easy to decide what my next post would be about.
When I used IBS twenty years ago, I called it Closing Range. It is what we used when I worked for Larry Connors and that is still the name I use now. But for this post, I will go with the more common name of Internal Bar Strength (IBS).
Calculation
The general concept of this indicator is simple. It is comparing the close of the day to the range between the high and low. When the close is at the low, the value is zero. When the close is at the high the value is 1.
IBS = (close – low)/(high-low)
My slight modification to this formula is I will multiply the IBS value by 100. This gives a range between 0 and 100.
The concept being this is a mean reversion indicator. When the IBS is low then one would expect the next day to close higher.
This indicator can be applied to other timeframes such as weekly or monthly or even over N-bars
Evaluation Method
When evaluating an indicator, one test I do is creating a very simple strategy. Then add the indicator and see how it changes the results. I test a range of the indicator values and see if they behave as I would expect.
I do not test this as a portfolio but as an “all-trades” test. I take all signals. I want to know how this improves the base strategy.
I will be testing IBS on a mean reversion strategy.
Buy Rules
- Stock is a member of the S&P500 Index
- 2-period RSI crosses below 2.5
- Close is greater than 200-day MA
- The 126-day return of the $SPX is greater than 0
- Buy 1 share on the next open
Sell Rules
- 2-period RSI closes above 50
- Exit on next open
Ten Buckets
The first step is to divide the IBS into 10 buckets and see how each perform. The added rule is
- IBS >= IBS_BOT and IBS < IBS_TOP
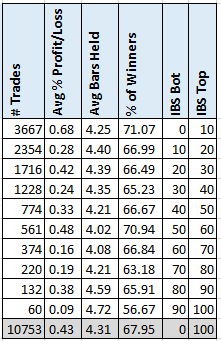
The bottom row results from not using any IBS filter. This gives us a base case that we are trying to improve on. The first thing to notice is that IBS under 10 gives a 58% increase. This also represents 34% of the trades. When the RSI gets this low, IBS is often low. There is a trend with higher IBS value to have fewer trades.
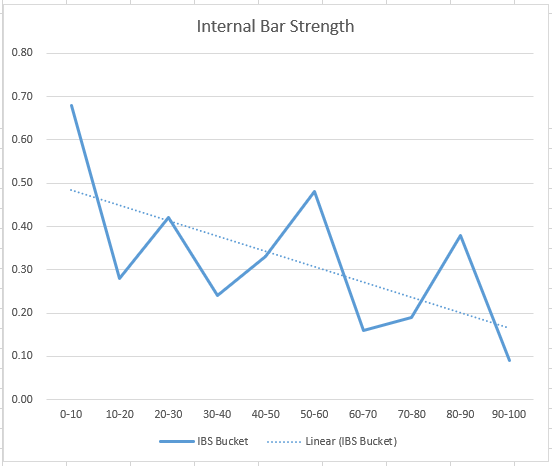
What about the avg %p/l trend? I like to see it trending down and it does.
The linear regression line does have a nice downslope.
The % winners also have the trend of going from 71% to 57% as IBS goes from 0 to 100. Another good sign for the indicator.
Four Buckets
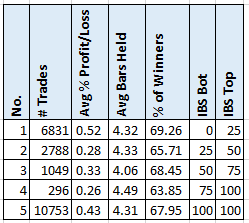
One issue with the 10 buckets, is the dramatic decrease in trades with IBS less than 10. Breaking IBS into 4 buckets gives the following.
With IBS less than 25, we keep 63% of the trades with a 21% increase in avg %p/l.
Final Thoughts
Using a low IBS value as an additional filter is helping identify those mean reversion trades that are likely to make money. Another insight is that high IBS trades are not good ones to take. I like indicators that work on both ends as this does.
The next question is can one create a mean reversion strategy using only IBS. I have not had success with this because IBS is only looking at a one-day mean reversion. You could calculate IBS over the last n-bars, to create a multi-day IBS. Maybe for another post.
If you are not using IBS on your mean reversion strategies, I recommend you give it a try.
Backtesting platform used: AmiBroker. Data provider: Norgate Data (referral link)
Good quant trading,


