- in Market Timing by Cesar Alvarez
Bear Markets Through the Decades
Several months ago, Steven (my trading buddy) and I were talking about bear markets. I felt that bear markets seem shorter and shallower now compared to the past. I thought this would be a quick and easy research project and blog post. Nope. As I generated numbers, more questions and research paths would be generated.
My questions are
- Are bear markets shorter?
- Are bear markets shallower?
Data & Date Range
The $SPX index will be used for these tests. I know this does not include the dividends but my $SPXTR data does not go back far enough.
Picking a start date turned out to be harder than I thought. My usual start date of 2007 did not give enough data. Eventually I decided on November 26, 1968. Why such an odd start date? I wanted to capture the bear markets of the 1970’s. But I also wanted to start at a new market high. This date is the first market new high before 1970.
What is a Bear Market
This turned out to be the first difficult question to answer. I started with two common definitions: (1) index under its 200-day moving average and (2) index is 20% or more off its all-time high. After running these numbers, I ran into the ‘bear’ market which was only a couple of days long. This is not a bear market. You need time.
After playing around with some different ideas, I settled on this definition. It is arbitrary but it captures what I wanted. Time in bear and recency.
3 parts to defining a bear market
- We will test two indicators. This is our Bear Signal.
- Close is 20% or more below all-time high.
- Close less than the 200-day moving average.
- The Bear Signal has been true for 50% or more days over the last 63 trading days
- The last Bear Signal happened in the last 10 trading days
If (2) and (3) are true, we are in a Bear Market. Using this definition, let’s see some numbers.
Bear Markets
20% Drawdown
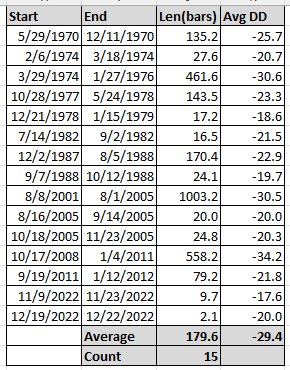
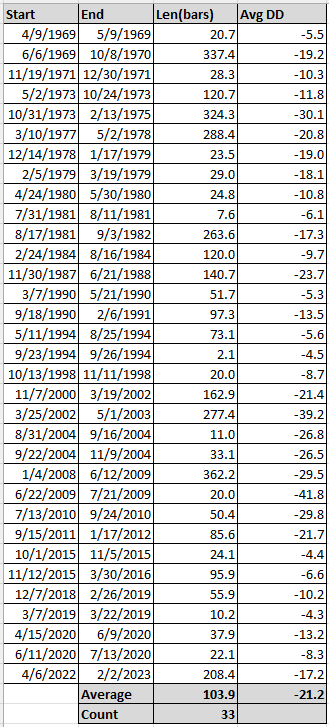
Table explanation. Using my definition, Start and End is the bear market start and end dates. Len(bars) is how many trading bars the bear market lasted. Avg DD is the average drawdown from all time high during the bear market.
I was surprised how few bear markets this gave. With 15 bear markets, there seems to be a pattern of oscillation from shorter to longer bear markets. We have some shallow ones and some deep ones.
200 Day Moving Average
There have been 33 bear markets since 1968. Looking at the average for those and then comparing to the individual ones, we can see a lot of variation. There seems to be times where we are way above the average and other times where we are way below the average. Again much like using the 20% drawdown, the pattern seems to oscillate.
These tests are not answering my questions. At this point, I decided to look at Market Regimes. What this means is large amounts of time defined to be in either a Bull or Bear Regime. I am thinking about 10 years at least.
Bear Regimes
How did I pick the regime start and end dates? The 1970’s are generally considered bear market years while 1982 is being the start of the great bull market of the 1980’s and 1990’s. I chose the end of a bear market in 1982, to end that Bear Regime and start the Bull Regime. To end that Bull Regime, I looked for the first bear market after the March 2000 top. To end the 2000’s bear market, I then looked for the first end of a bear market in 2012. Now these dates are somewhat arbitrary but they cover a length of at least 10 years and feel about right.
20% Drawdown
Wow, this turned out to be way more informative than I expected. A clear difference between Bear & Bull Regimes. Both in percentage of time in a bear market and the average depth of the bear market. Looking at the CAR, I am happy with the method used to choose the regimes.
This Bull Regime has had fewer and less severe bear markets compared to the previous Bull Regime. Though one thing I do not like is that the 1982 Bull Regime does not end until August 2001 which surprised me.
Will the pattern hold with the 200-day MA test?
200 Day Moving Average
Now the two Bull Regimes are much more similar in terms of time in bear and depth. What it is interesting here is that this bull market has had the benefit of low interest rates and government intervention, and yet the CAR is much less than the previous Bull Regime. Though it would be nice to have another 6 years of this Bull Regime to match the previous one.
The Crew Discussion
On August 28th at 10am PT, my private trading group will be discussing these results. Join for a free 1-week trial and attend live or watch the recording. For more information on The Crew, click here.
If you are already a member of The Crew, click here for time and Zoom information.
Final Thoughts
For Regime tests, the sample size is very small, but the pattern is clear. Bear Markets in this regime are different. Compared to the previous Bull Regime, my feeling that this Bull Regime has less bear markets and not as deep is not quite correct. The “20% Drawdown” and “200 Day Moving Average” gave different results for time in bear. But for average depth of bear, this Bull Regime is not as bad.
Good quant trading,

le>


