- in Stocks , Trend Following by Cesar Alvarez
Low Volatility Stocks: 20%+ CAGR Portfolio
Continuing on from our previous posts and research, Should one trade high or low volatility stocks? , Stops and trading high vs low volatility stocks, and Low Volatility Stocks and Profit Targets, we are now testing how these results translate to a portfolio. I pick one variation from each of the tables from the Low Volatility Stocks and Profit Targets. From that one a variation we create a portfolio with a maximum of 10 stocks.
General Rules
The test range is from 1/1/2004 to 12/31/2013 using Norgate Data. The universe is the Russell 3000 index as it is existed.
Buy Rules
- Stock has 21 day moving average dollar-volume greater than 10 million over the last 3 months
- Close is greater than $5
- Is in theRussell3000 index on the signal date
- Six month return is greater than 10%
- Close is greater than the 200 day moving average
- The SPX close is above the 200 day moving average
- The stock’s 100 day historical volatility(HV100) is between 20 and 35 for the last 5 five days
Buy rules 1 & 2 are liquidity rules. Rules 4 & 5 are a simple way to determine that the stock is an uptrend. Rule 6 is our market timing rule. Since we are trading longer term, we want the market wind at our back.
Sell Rules
See the Low Volatility Stocks and Profit Targets post for the tables. These were chosen to show different exits and had good overall numbers.
- From the ‘Avg % Profit/Loss’ table, stop method is ‘Month: 6’ and profit method is ‘% Target:20’
- From ‘% Winners’ table, stop method is ‘Month: 6’ and profit method is ‘ATR Target:4x’
- From ‘Individual Trade Quality (ITQ)’ table, stop method is ‘% trailing stop: 20 and profit method is ‘% Target: 20’
- From ‘Profit Potential’ table, stop method is ‘Month: 6’ and profit method is ‘None’
Each of these sell rules will be tested independently.
Ranking Methods
For those not familiar with AmiBroker, it uses s ranking variable to determine which stocks to enter when you have more signals than available positions to enter. This variable ranks from the highest absolute value to the lowest absolute value. These are the ranking methods I tested with an explanation of what the highest stocks are and the AmiBroker code used.
| Spreadsheet Name | AFL Formula | Prefer Stocks that |
| % Above MA200 | C/MA(C,200) | More stretch away from their MA200 |
| 100-% Above MA200 | 100-C/MA(C,200) | Are closest to their MA200 |
| 1000 – ROC 1 Month | 1000-ROC(C, 21*1) | With the worst 1 month return |
| 1000 + ROC 1 Month | 1000+ROC(C, 21*1) | With the best 1 month return |
| 1000 – ROC 3 Month | 1000-ROC(C, 21*3) | With the worst 3 month return |
| 1000 + ROC 3 Month | 1000+ROC(C, 21*3) | With the best 3 month return |
| 1000 – ROC 6 Month | 1000-ROC(C, 21*6) | With the worst 6 month return |
| 1000 + ROC 6 Month | 1000+ROC(C, 21*6) | With the best 6 month return |
| ADX(21) | ADX(21) | Highest 21 period ADX |
| 1000-ADX(21) | 1000-ADX(21); | Lowest 21 period ADX |
| HV100 | StDev(log(C/Ref(C,-1)),100)*(252^.5)*100 | Highest 100 day historical volatility |
| 1000-HV100 | 1000-StDev(log(C/Ref(C,-1)),100)*(252^.5)*100 | Lowest 100 day historical volatility |
| HV50 | StDev(log(C/Ref(C,-1)),50)*(252^.5)*100 | Highest 50 day historical volatility |
| 1000-HV50 | 1000-StDev(log(C/Ref(C,-1)),50)*(252^.5)*100 | Lowest 50 day historical volatility |
| RSI14 | RSI(14) | Highest 14 period RSI |
| 100-RSI14 | 100-RSI(14) | Lowest 14 period RSI |
| abs(MA(C,50)/MA(C,200)-1) | abs(MA(C,50)/MA(C,200)-1) | Have their Ma50 furthest from their MA200 |
| 100-abs(MA(C,50)/MA(C,200)-1) | 100-abs(MA(C,50)/MA(C,200)-1) | Have their Ma50 closest to their MA200 |
As you can see, I tried lots of ideas. I am not as familiar with longer holds strategies and tried what came to mind. The last two ideas came from the following post: https://www.quantopian.com/posts/momentum-strategy-with-a-dynamic-universe. One will also noticed that I tried ranking both ways. For example, I looked at highest ADX21 and lowest ADX21. We do this for two reasons. First, one never knows which one will work. Two, if a particular method gives good results, it is good to see that the inverse of it gives poor results. This helps confirm the ranking method.
Baseline
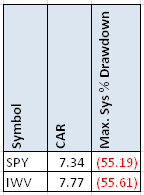
We are looking for results that are 2-3x the CAR with half the drawdown. That is my baseline for longer term strategies.
The Results
Avg % Profit/Loss – stop method is ‘Month: 6’ and profit method is ‘% Target:20’
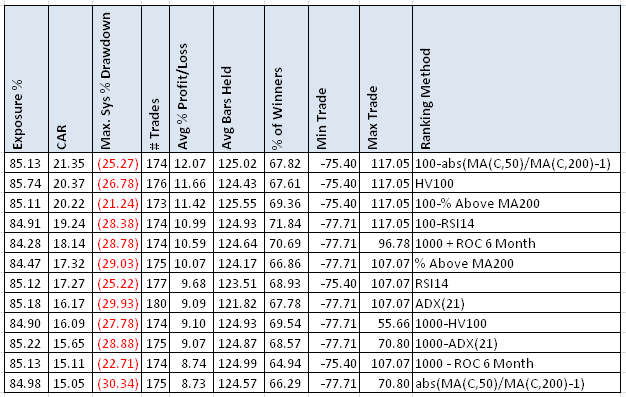
We have hit are target CAR, about 2.3x, and MDD with two runs. A couple things stand out here. First, the best CAR ranking method also has the best MDD. That rarely happens. The ranking method is not what I expected to be best. The ranking method wants stocks that have their MA50 & MA200 close together. I like that for a long term hold that the % Winners are above 65% in most of these. Does this pattern holds for the other exits?
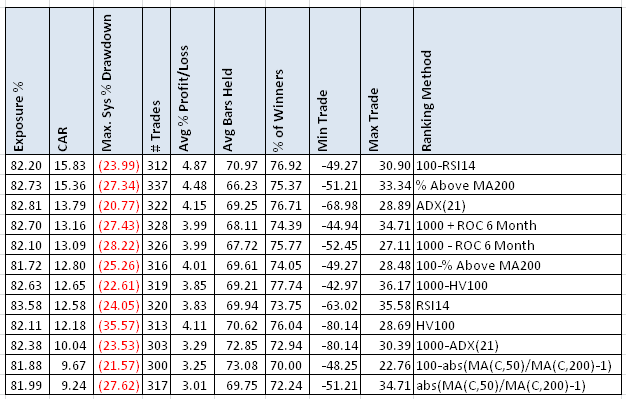
% Winners – stop method is ‘Month: 6’ and profit method is ‘ATR Target:4x’
Again, we have hit are target CAR, about 2.3x, and MDD with two runs. Well, our great new ranking method has now ended up on the bottom of the list. But the previous #2 & #3 ranking methods are still in the top 3.
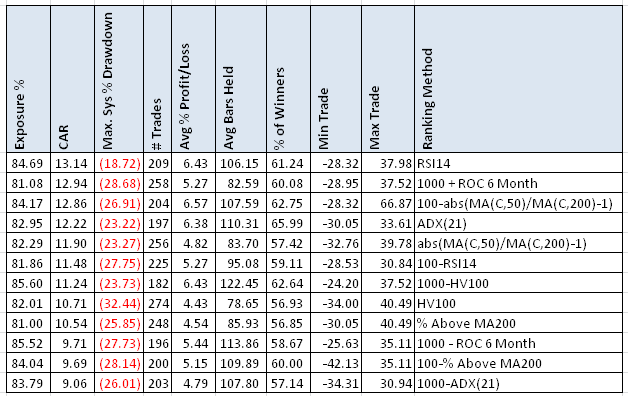
Individual Trade Quality (ITQ) – stop method is ‘% trailing stop: 20 and profit method is ‘% Target: 20’
None of the ITQ results meet our bar for CAR. Focusing on ITQ does not seem to be a winner for longer term holds.
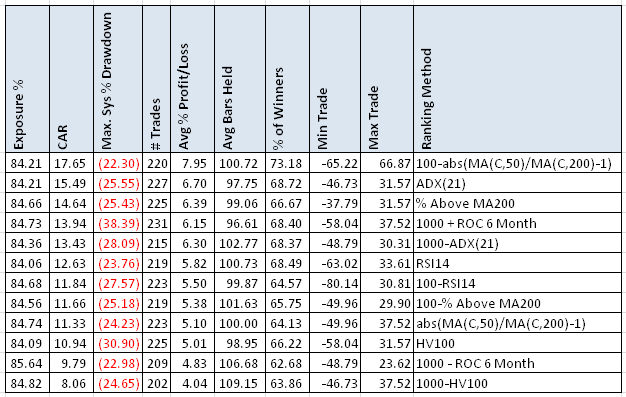
Profit Potential – stop method is ‘Month: 6’ and profit method is ‘None’
Focusing on profit potential definitely is the way to go. All the runs beat our CAR goal and about half of them beat our MDD goal. Again the ranking method of having the MA50 & MA200 near each other came out on top.
As a reminder of the exits for this test, we have no stop loss, no profit target. We simply get out 6 months after entering. One must endure a huge 70% loss in one trade. But for such a simple exit method, it produces the best CAR, over 65% winners for a long term system and decent MDD.
Would I trade this? Not quite. I would want the CAR a little higher and the MDD a little lower. But it is really close. I will look into this more for my personal trading account. This may be a good strategy to trade in retirement account.
Spreadsheet
If you’re interested in a spreadsheet of the data used to generate these tables, enter your information below, and I will send you a link to the spreadsheet. The spreadsheet includes the other ranking methods not shown.
Backtesting platform used: AmiBroker. Data provider:Norgate Data (referral link)
Final Thoughts
After four posts on this, these tests produced lots of surprises for me. In the past I had never focused on profit potential but will do in the future. We have a long-term hold strategy with over 65% correct trades. Most of the time I am happy if I get 45% winners in a long-term hold strategy. We have a new ranking method in having the MA50 & MA200 close to each other. I hope you have enjoyed the journey, I know I did.

