Author Archives: Cesar Alvarez

September 6, 2017
- in Mean Reversion , Research by Cesar Alvarez
Broken Strategy or Market Change: Investigating Underperformance
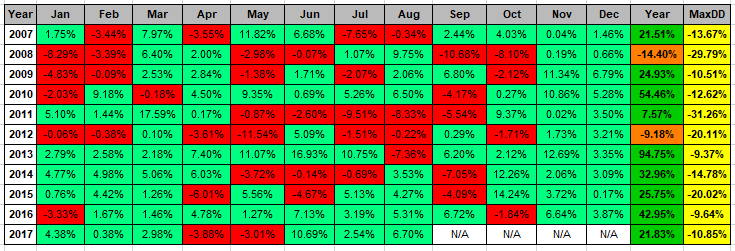
I recently had someone email me about the performance of a strategy I created back in late 2005/early 2006 and traded for a few years. I remember the strategy being a daily mean reversion set up with an intraday pullback entry. I figured it probably had not done well over the last decade. I stopped trading in the middle of 2008 because I did not like how it was behaving. In the backtest it did well in bear markets but was not doing so in the middle of 2008.
I ran the strategy from 2007, using the rules as they were published and was pleasantly surprised by the results. A CAR of 25%. Overall not too bad. Wish I had still been trading it. This is an eleven year out of sample test.
August 23, 2017
- in ETFs , Trend Following by Cesar Alvarez
Sector trading using the 200-day moving average – Part 2
Several readers asked for additional tests to be done on the strategy on Sector trading using the 200-day moving average. We will be testing allocated 11% per ETF instead of 10%, using asymmetric number of days and adding IEF to the SPY MA200 10 day test.
August 2, 2017
- in ETFs , Trend Following by Cesar Alvarez
Sector trading using the 200-day moving average
A user commented on ETF Sector Rotation post about a simple idea for trading the sector ETFs, which I can’t believe I have never tried. I like keeping things simple just like my Brazilian Jiu-Jitsu game.
July 12, 2017
- in Research by Cesar Alvarez
Out-of-sample testing and luck
Continuing from the last post, I will show how using different definitions of passing our out-of-sample test can change our results. How luck can play a role if you use only one strategy to test out-of-sample. How you split your in-sample(IS) and out-of-sample(OOS) can change results.
June 21, 2017
- in General by Cesar Alvarez
In-Sample and Out-Of-Sample Testing
I am frequently asked if I do out-of-sample testing. The short answer is not always and when I do, it is not how most people do the test. There are lots of considerations and pitfalls to avoid when doing out-of-sample testing. Out-of-sample testing is not the panacea it is made out to be. There are lots of grey areas which I will discuss below.
May 31, 2017
- in Research by Cesar Alvarez
Can A Simple Market Timing Indicator Be Beat?
As long time readers of my blog know, I often use a market timing indicator in my strategies. My favorite one, and a simple one, is using the 200 day moving average on either the SPY or S&P 500 Index. I recently ran into these posts, Using Market Breadth To Gauge Market Health (Part 5) and Matt’s Breadth Indicator. Matt’s Breadth Indicator (MBI) intrigued me because I had not seen something like this and conceptually it is simple. I also liked that it was not “easy” to test or optimize on. Therefore hopefully not many people would be using this indicator and I could potentially find better values.
May 3, 2017
- in Research by Cesar Alvarez
ConnorsRSI Strategy: Sensitivity Analysis
In Simple ConnorsRSI Strategy on S&P500 Stocks I showed a ConnorsRSI strategy on S&P500 stocks. In ConnorsRSI Strategy: Optimization Selection, I narrowed down the optimization to three potential variations that one could consider trading. This post will explore Sensitivity Analysis (also known as: Parameter Sensitivity) to help guide us on what to expect from each variation.
April 12, 2017
- in Mean Reversion , Research , Stocks by Cesar Alvarez
ConnorsRSI Strategy: Optimization Selection
In the previous post, Simple ConnorsRSI Strategy on S&P500 Stocks, I showed a simple strategy which I optimized which gave 1,300 variations. Today, I will cover various methods to choose a strategy to potentially trade.
March 27, 2017
- in General by Cesar Alvarez
CORRECTION: Simple ConnorsRSI Strategy
While doing the research for the next article based on Simple ConnorsRSI Strategy on S&P500 Stocks, I discovered that I had not tested what I wanted. Unfortunately errors are made while doing research and my goal is to catch them before publishing them. I did not in this case. Fortunately the results did not significantly change. The top CAR went from 27.32 to 26.63. As usual the error made the numbers comes down. Why is it that it never happens that they go up? See the post for the corrected numbers. I have also uploaded a new corrected spreadsheet.
Good Quant Trading,

March 15, 2017
- in Mean Reversion , Stocks by Cesar Alvarez
Simple ConnorsRSI Strategy on S&P500 Stocks
A frequently asked question is how I pick which variation from an optimization run to trade. This post will cover a ConnorsRSI strategy on S&P500 stocks. We will use a wide range of parameters to give us lots of choices to be used in the next post. In that next post, I will show how I take the results and narrow them down to one potential variation to trade. And then the final post, I will cover parameter sensitivity to help determine if the results are likely overfitted or not.
3/27/2017 CORRECTION: When I originally posted this, the results shown in the tables were not for the rules shown below. The table results are now matching the rules as below. The spreadsheet also has the corrected results.
