Author Archives: Cesar Alvarez
- in General by Cesar Alvarez
Ulcer Index: An underutilized portfolio metric
About two years ago, I started using the Ulcer Index as another evaluation metric for portfolio backtests. I like how it captures both drawdown and drawdown length. It helps differentiate similar looking portfolios using the common metrics of Compounded Growth Rate, Share Ratio, and Maximum Drawdown. My plan was to write a blog post about it and then add it to the metrics I show on the blog. The blog Flirting With Models, found through the quant mashup Quantocracy, just made a great post on it which I highly suggest you go read: Looking into the Ulcer Index. They did a great job and saved me a post. I will show this metric on future portfolio tests.
- in Research , Stocks by Cesar Alvarez
How to beat the market by throwing darts
During some recent research I noticed that picking random stocks in the SP500 produced returns much better than I would expect. This observation was recently echoed by another researcher that I know. Could one make a market beating system by basically randomly pick stocks?
The research that led to this observation was on market timing. Can having a good market timing rule, a profit target and stop loss be enough to randomly pick stocks and beat the market. The answer may surprise you.
- in Research by Cesar Alvarez
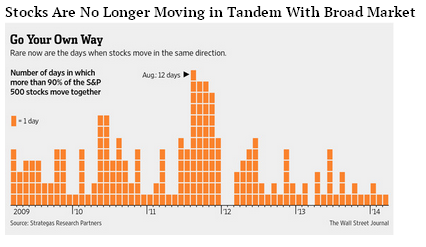
Are S&P500 Stocks Moving Less In Tandem?
I saw this interesting graph the other day on The Big Picture and wanted to know more. Are stocks really moving less in tandem? Could there be another explanation for what is going on? Researching the numbers behind the chart may provide some interesting insights.
From: WSJ
- in Stocks , Trend Following by Cesar Alvarez
DTAYS Weekly Breakout Strategy
After my interview on ‘Don’t Talk About Your Stocks’, (site no longer exists)’ Andrew pointed me to a strategy he is trading called the DTAYS Quantitative Growth Fund. He was curious to see back tested results. Always looking for new ideas to write and tested, I jumped on it.
Unfortunately, the results will not be exactly as he trades it. Andrew uses the IBD50 as his trading universe. As is the bane to stock researchers, I do not have historical data on the IBD50. One could create some great models using that data. Instead, the test will be on the standard stock universe
- in General by Cesar Alvarez
Podcast interview on ‘Don’t Talk About Your Stocks’
Last week I was interviewed by Andrew Selby of Don’t Talk About Your Stocks. We covered lots of topics in the 45 minute interview. We covered my trading mistakes, why you need a trading buddy, matching your trading style to your personality, and many more topics.
Link: http://www.donttalkaboutyourstocks.com/dtays-016-cesar-alvarez/
If you have any questions from the interview, post them in the comment section of this page.
- in Mean Reversion , Research , Stocks by Cesar Alvarez
How much does not having survivorship free data change test results?
Over the last month several people have asked me how important it is to have survivorship-free data. For any researcher this is an important question to understand how the different data can change your results. We will be exploring three potential data issues: as traded prices, delisted stocks (survivorship-bias), and historical index constituents (pre-inclusion bias).
- in Rotation , Stocks by Cesar Alvarez
S&P500 Monthly Rotation-Readers’ Ideas
The ‘Intermediate Term Stock Rotation Strategy Using S&P500 Stocks’ post generated lots of reader suggestions on what to investigate further.
The ideas we will investigate are:
- Monthly rotation (instead of quarterly)
- Using an additional filter to make sure the stock is healthy. These include
- Close above 200 day moving average
- Close above 50 day moving average
- 50 day moving average above 200 day moving average
- Stock return over look back period is positive
- In the last 10 days the stock has made a 1 month high
- In the last 10 days the stock has made a 3 month high
- Maximum loss stops
- in General by Cesar Alvarez
The issues with back testing a short stock strategy
I have been shorting stocks since 2006 using a quantified strategy that has remained relatively unchanged through the years. From 2006 to 2012, the strategy was one of my most consistent and profitable of all the strategies I have traded. I love shorting stocks because it is very hard psychologically, because of that, I believe that there is a good edge there. The test results have always bothered me because of the differences between back tested assumptions that sometimes are challenging to actually reproduce in real-world trading. Then in 2013 my fears became realized and all four fears below really hit me.
- in Rotation , Stocks by Cesar Alvarez
Intermediate Term Stock Rotation Strategy Using S&P500 Stocks
One of my research goals for this year is to find an intermediate term rotation strategy using S&P500 stocks. Then right on cue, I read the following post Intermediate momentum! which points to research Is momentum really momentum? by Robert Novy-Marx. In that he mentions that “intermediate horizon past performance, measured over the period from 12 to seven months prior, seems to better predict average returns than does recent past performance.” I have never tried an idea like this. In the blog comments, a user says he got great results using the current NDX100 stocks not the historical. This introduces pre-inclusion bias but maybe the results will still be good. What a great way to start the year with ideas I have never tested.
- in Research by Cesar Alvarez
Stop Losses and Equity Curves
This extended research is from two readers’ requests. Request one is adding stop losses on the “Monthly S&P500 Stock Rotation Strategy.” Request two is seeing the equity curves from “Percent S&P500 Stocks Trading Above MA50 as Market Timing Indicator.”


