October 21, 2015

Biotech: My love-hate relationship

My love

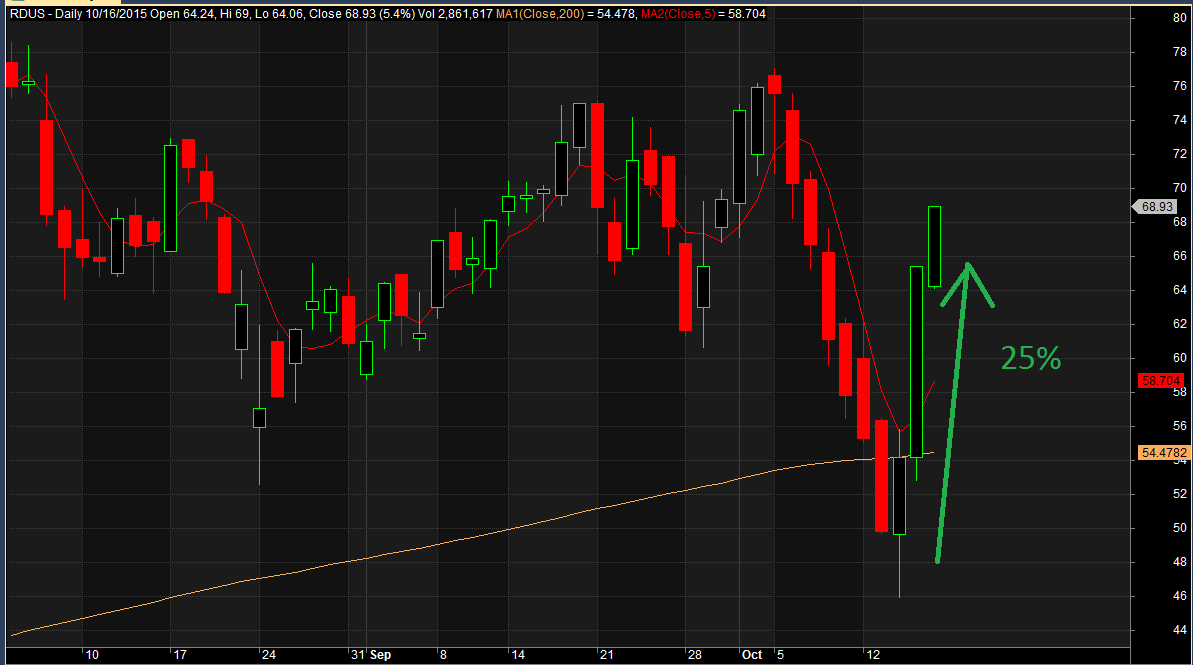
RDUSa

My hate

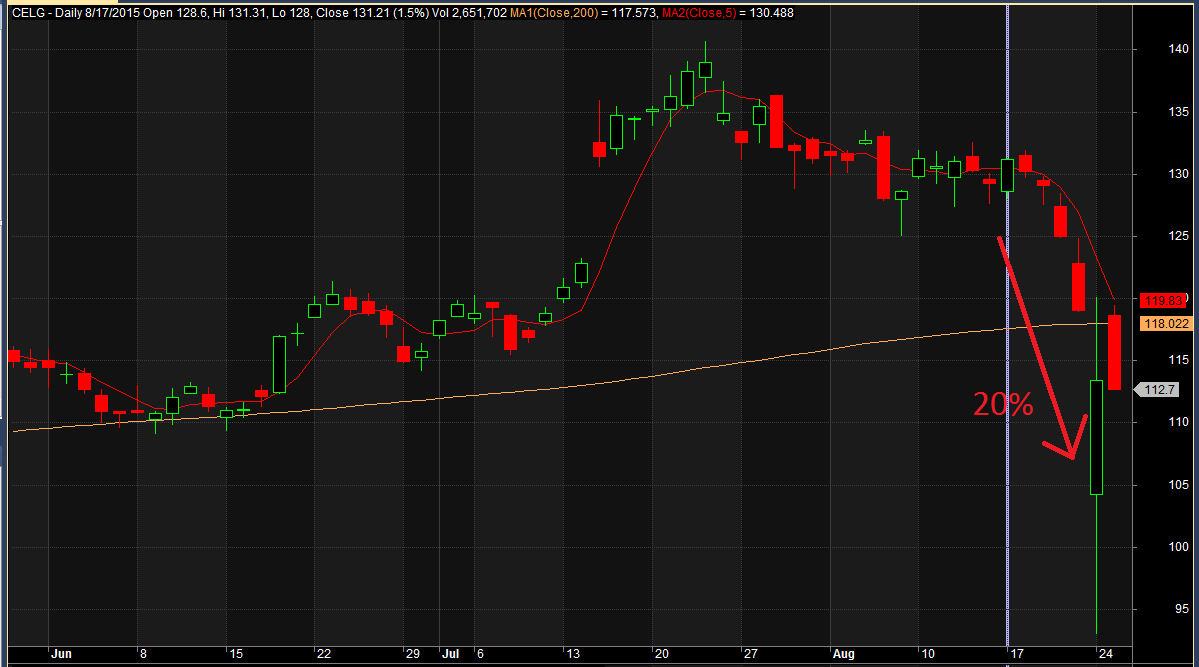
CELGa

The two charts above are from recent trades I have taken. Charts created in AmiBroker.

On July 20, 2015 IBB, iShares Nasdaq Biotechnology ETF, made a closing high of 398.  About three months later it closed at 289 for 27% loss. A very common thing I hear from traders is that they “don’t trade biotechnology or pharmaceutical stocks.” I completely understand. These stocks tend to be very volatile and news driven. But does removing these stocks really reduce your drawdowns? What happens to your Compounded Growth Rate? Time to see what the research shows us.

The data

I am using Norgate Data which has Industry Classification Benchmark (ICB) for most stocks. One bias to this test is that the classification is only for the last day of the stock. If a stock changed classification through its history, this would not be caught. I am not too concerned about this.

The rules

Setup

  • Close greater than 100-day moving average
  • Close less than the 5-day moving average
  • 3 lower lows
  • Member of the Russell 1000 (will also test Russell 3000)
  • 21-day moving average of dollar-volume greater than $10 million
  • Price as trade greater than 1

Buy

  • Rank stocks from high to low using 100 day Historical Volatility
  • Place orders for the top ranked stocks such that if they all get filled will be 100% invested. This means orders will often not get filled even though lower ranked stocks may have
  • Set a limit buy order for the next day if price falls another .5 times 10-day average true range.

Sell

  • Close greater than 5 day moving average (Corrected on 11/4/2015: Close is greater than the previous day’s close)
  • Sell on the next open

Misc.

  • Maximum of 15 positions
  • 6.7% allocation per position
  • No margin is used

The results

Tested from 1/1/2005 to 9/30/2015

151021

Will be focusing on CAR, MDD, the average of the 5 worst drawdowns, the worst trade, and the avg of the worst 50 trades. Biotech makes 3.7% of trades when using the Russell 1000. While Biotech and Pharmaceuticals are a total of 6.2% of the Russell 1000 trades. The total for both jumps to 12.2 when using the Russell 3000.

Removing biotechnology and pharmaceutical stocks

Next we remove any stocks classified “Biotechnology” or “Pharmaceuticals.”

Russell 1000 Results

151021a

Removing them, reduces the CAR with a slight increase in the MDD and worst 5 drawdowns. The top 50 losses does improve slightly. In this case removing them has a negligible effect on the results.

Russell 3000 Results

151021b

This test has a bigger change. Removing them reduces the CAR 21% while only reducing MDD 2%. The worst 50 trades does improve by 8%.

Spreadsheet

Fill the form below to get the spreadsheet with lots of additional information. This includes yearly breakdown, top 5 drawdown and other stats.

Final Thoughts

As tends to happen often, one cannot generalize test results. Removing biotechnology and pharmaceutical stocks had minimal change in the numbers on the Russell 1000. Small enough that I would likely not trade them if that was my strategy. Even though you may get some large winners having to deal with the large losers is psychological tough.

But the results on the Russell 3000 are different enough. In this case I would likely stick with biotechnology and pharmaceutical stocks.

I will be revisiting my current strategies to see what happens to them when I remove biotech and pharma stocks.

As always test what you are trading. You cannot generalize test results.

Tell Me

Tell me in comments below if you trade or don’t trade biotechnology and pharmaceutical stocks and why.

Backtesting platform used: AmiBroker. Data provider:Norgate Data (referral link)

Good Quant Trading,

Fill in for free spreadsheet:

spreadsheeticon


Visited 22 times, 1 visit(s) today

Click Here to Leave a Comment Below

Ilya KIpnis - October 21, 2015 Reply

Hah. Good timing, Cesar. Valeant just got meteor-smashed today. Bye bye, 30% in a day. Heh.

Biotechs are definitely volatile. The question is what sort of dynamic trend-following indicator would properly continuously recalibrate itself to keep up with things.

    Cesar Alvarez - October 21, 2015 Reply

    That is good timing on VRX. It is interesting that it is not a gap but intraday sell off. That is not normally how the biotechs move.

Curt - October 22, 2015 Reply

Cesar,

Premium Data provides two different industrial categorizations for stocks, ICB and GICS. This Investopedia article describes the two and says tey are more similar than different:

http://www.investopedia.com/articles/stocks/08/global-industry-classification-industrial-classification-benchmark.asp

It also says “The largest difference between the two is how consumer businesses are classified at the sector level. With the ICB, companies doing business with consumers are divided into providers of goods and providers of services; with the GICS, companies are classified by cyclical/non-cyclical distinctions, or between discretionary spending and the staples of everyday life.”

So I was wonderring if you had a reason for selecting ICB over GICS?

    Cesar Alvarez - October 22, 2015 Reply

    There was no real reason for picking one over the other. It was basically a coin flip. I guess I could test using GICS and see if the results change much.

James - October 22, 2015 Reply

A key to profitable investing in sectors has been to: 1) know what part of the year statistically favors certain sectors and 2) identify if a High Risk profile is present in order to reduce position size / go to cash ( 2015 was identified as a HIgh Risk year in Jan https://stockmarketmap.wordpress.com/2015/01/19/market-map-allocates-to-cash/ )

https://docs.google.com/spreadsheets/d/1zlgOYdATSzC7YrUE9yE_uY03sHBRTcLUVyKusqqv2tI/edit#gid=113856734

    Cesar Alvarez - October 23, 2015 Reply

    The strategy that trade the stocks on this post, trades R3000 stocks. It is not a sector based strategy. An interesting strategy that you have there.

Kirk Dolan - October 23, 2015 Reply

Thank you for the good biotech backtesting information.
I do trade biotech and pharmaceutical stocks with only one exception: If FDA is about to give a ruling. The reason I trade them is that my backtesting on a mean-reversion strategy shows that CAR/maxDD increases when lower-priced stocks are included. This result was unexpected to me. Some of the lower-priced stocks include biotech and pharmaceuticals.

    Cesar Alvarez - October 24, 2015 Reply

    It is a tradeoff. As long as people make it informed, it really does not matter which wayone goes

matt haines - November 25, 2015 Reply

Hi Cesar. I’ve kept this post open in my browser tabs for a few weeks now, as I was meaning to comment. Finally got around to it!

Like you, I use the combination of AmiBroker and Premium Data. I noticed you did your testing on the Russell 1000 and Russell 3000 lists. However am I to assume that this is testing the *current* members of the R1k and R3k? Even though those tickers may not have been members?

I haven’t found an easy way to account for historical membership in an index using this data provider/software combo. Just wondering if there’s a secret I’m unaware of. For speed’s sake I will develop systems using the current R3k list, knowing that it introduces a bias that gets bigger, the further back in time I test. I then widen the scope to delisted stocks when I’m ready for a final out-of-sample test.

Leave a Reply: