- in ETFs , Rotation by Cesar Alvarez
Country ETF Rotation – Reader’s Suggestions
My last post on Country ETF Rotation generated several ideas of what to test to improve the results. See the original post for the list ETFs being traded. One important test I left out from the original post was a baseline case. An idea applied to all the tests was trading more ETFS. For all tests, I will be showing results of trading (2,5,8) ETFs in the spreadsheet. Testing is from 1/1/2007 to 12/31/2016.
Baseline
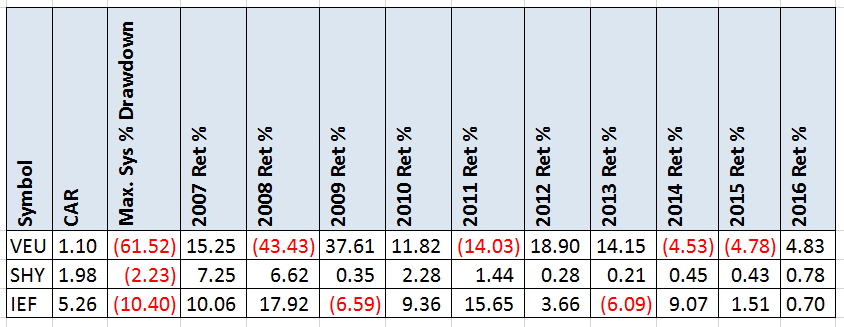
Here are the buy and hold results of VEU, the all world ex-US ETF. From this, I can tell that my goals for this test on the last post were much too high for CAR. I also added the results for Buy and Hold for SHY and IEF since these are used for our safety ETF in some tests.
Idea: Sum the Ranks
The first idea is simply to add the ranks of multiple timeframes, instead of using one rank only.
Rules
- At the end of the month,
- Consider ETFs only with the 21 day moving average of Close * Volume over $5 million
- RankA is rank of 3 month returns
- RankB is rank of 6 month returns
- RankC is rank of 9 month returns
- RankD is rank of 12 month returns
- RankFinal = RankA + RankB + RankC + RankD
- Buy the top (2,5,8) ETFs on the next open
- But if the top ranked ETF is below the their (6,12) month moving average, then instead of buying the ETF buy the alternative ETF(SHY,IEF). The spreadsheet also shows uses a filter if (6,12) month return is negative.
Results
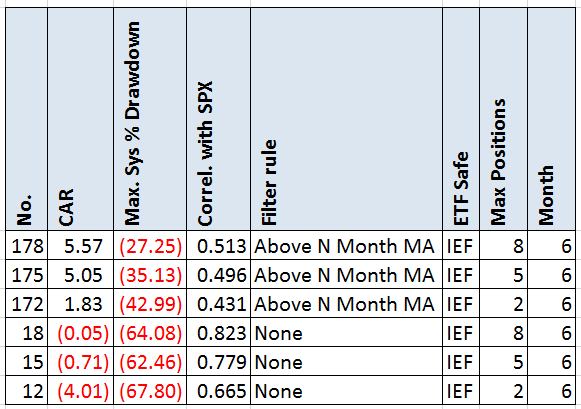
Without the filter, these results are worse than buy and hold. With the filter, they are still worse than buy and hold on IEF. Nothing here.
Idea: Reverse the Rules
A simple idea of reversing the original test rules for ranking.
Rules
- At the end of the month,
- Consider ETFs only with the 21 day moving average of Close * Volume over $5 million
- Rank the ETFs from low to high of their (3,6,9,12) month returns
- Buy the top (2,5,8) ETFs on the next open
- But if the top ranked ETF is below the their (6,12) month moving average, then instead of buying the ETF buy the alternative ETF(SHY,IEF)
Results
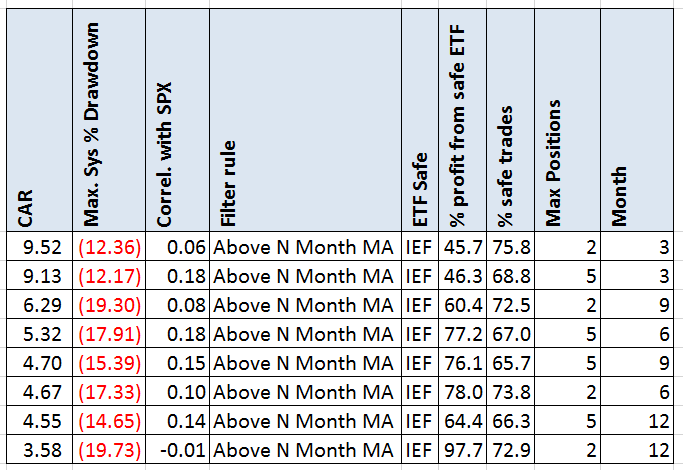
These results got me excited. The CAR was in the high single digits with low drawdowns. No correlation with SPX. But then I then investigated what percentage of the profits was coming from the safe ETF. It is quite high. This is not bad but would happen when these ETFs started doing well?
Idea: Use mean reversion rule – % off High
The next idea is to use a short term mean reversion rule for rank 1.
Rules
- At the end of the month,
- Rank1 = rank the ETFs by the percent off their (5,10,15,20) day high
- Rank2 = rank the ETFs from high to low of their (3,6,9,12) month returns
- Rank3 = Rank1 + Rank2
- Rank rank3. If ties occurs, use (Rank1,Rank2) as the tie break.
- Buy the top (2,5,8) ETFs on the next open
- But if the ETF is below the their (6,12) monthly moving average, then instead of buying the ETF buy the alternative ETF(IEF)
Results
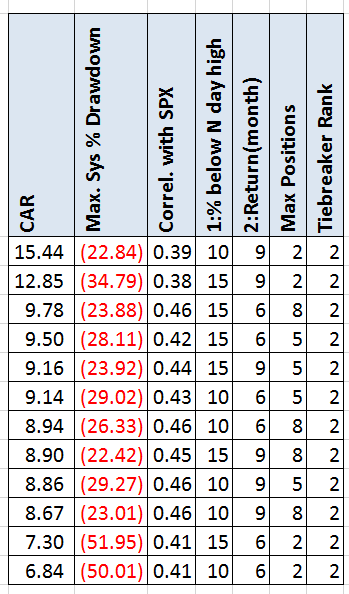
Now we are seeing some good numbers. CAR above 10% and DD under 30%. Surprisingly the correlation number is also under .50 which is what I was looking for in the previous post. What I don’t like is that there is large gap between the top results and those underneath them. But this looks like an area of promise.
Idea: Use mean reversion rule – RSI
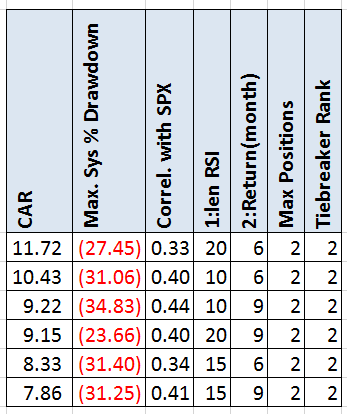
This time we use RSI.
Rules
- At the end of the month,
- Rank1 = rank the ETFs by RSI(N) where lower is better. N of (5,10,15,20)
- Rank2 = rank the ETFs from high to low of their (3,6,9,12) month returns
- Rank3 = Rank1 + Rank2
- Rank rank3. If ties occurs, use (Rank1,Rank2) as the tie break.
- Buy the top (2,5,8) ETFs on the next open
- But if the ETF is below the their (6,12) monthly moving average, then instead of buying the ETF buy the alternative ETF(IEF)
Results
Again, we are seeing some potential. A recent sell off seems to help.
Idea: Use mean reversion rule – Recent Return
Now we just reverse the return rank for rank 1 to prefer self offs.
Rules
- At the end of the month,
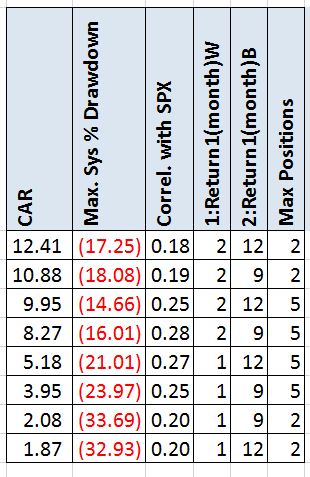
- Rank1 = rank the ETFs from low to high of their (1,2,3) month returns
- Rank2 = rank the ETFs from high to low of their (6,9,12) month returns
- Rank3 = Rank1 + Rank2
- Rank rank3. If ties occurs, use (Rank1,Rank2) as the tie break.
- Buy the top (2,5,8) ETFs on the next open
- But if the ETF is below the their (6,12) monthly moving average, then instead of buying the ETF buy the alternative ETF(IEF)
Results
This produced the best results. Decent CAR with low drawdown and no correlation. I should explore this one more to see if there is something worth trading.
Spreadsheet
File the form below to get the spreadsheet with lots of additional information. This includes yearly breakdown, all the variation results, holding 1-8 ETFs and much more.
Final Thoughts
Thank you for all of you that posted ideas to test. Dong the research took longer than expected but it was worth it. As always if you have an idea, put it in the comments below.
Backtesting platform used: AmiBroker. Data provider:Norgate Data (referral link)
Good quant trading,

Fill in for free spreadsheet:
![]()

