- in ETFs , Rotation by Cesar Alvarez
Day of month pattern or luck for a monthly ETF rotation strategy?
From my post on Heikin-Ashi Charts, another researcher wrote Luck: The Difference Between Hired or Fired about how luck of the draw could account for the difference in returns depending on the starting date. This is a completely valid question. Are three better returns for a strategy in a particular area of the month or is it random? I do believe that luck plays a large part in our trading results, which is a future blog post. But from previous work on 5 day holds, I know that the end of the month and beginning on the month tend to be better times for ETF mean reversion.
I have been investigating monthly ETF rotation strategies lately. This would be a good time to combine two projects. A simple monthly ETF rotation strategy and comparing the results to depending on what day of the month the rotation is done on. Would the end and beginning of the month advantage be true also for monthly holds?
ETF Universe
For the ETF universe we will use the Select Sector SPDR ETFs of XLE, XLU, XLK, XLB, XLP, XLY XLI, XLV and XLF. The ETFs IEF, TLT and SHY are added for our cash position when the markets go down.
Testing Timeframe
The tests are from 1/1/2005 to 10/31/2014.
Days Before The Beginning Of The Month
The first test will be the number of trading days before the beginning of the month. For this test, the value N is the number of trading days before the beginning of the month and this day is the setup day. If one wanted to have the setup day be the last trading day of the month with entry on the first trading day of the month, then N would be 1.
Rules
- On the Nth trading day before the beginning of the next month.
- Rank all ETFs by their 3 month returns from high to low. This is RankA.
- Rank all ETFs by their 6 month returns from high to low. This is RankB.
- Add RankA+RankC and then Rank again from low to high. This is RankC
- Buy the top two ETFs in RankC. In case of ties, buy the ETF with the lowest 21-day historical volatility
- Entry is at the next open.
- Each month sell all ETFs and re-rank.
Results
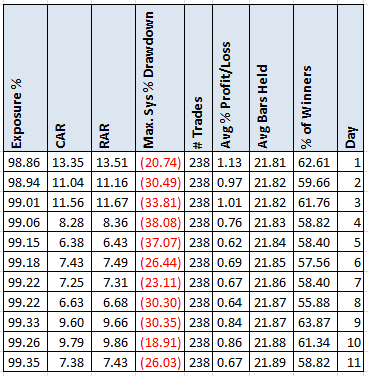
Already we are seeing a pattern of higher returns when entering near the end of the month. The difference in CAR between the last day of the month and the 11 days before the beginning of the month is 36%. That is huge
Days After The Last Of The Month
The next test will be the number of trading days after the last day of the month. For this test, the value N is the number of trading days after the last day of the month and this day is the setup day. If one wanted to have the setup day be the first trading day of the month with entry on the second trading day of the month, then N would be 1.
Rules
- On the Nth trading day after the last day of the previous month.
- Rank all ETFs by their 3 month returns from high to low. This is RankA.
- Rank all ETFs by their 6 month returns from high to low. This is RankB.
- Add RankA+RankC and then Rank again from low to high. This is RankC
- Buy the top two ETFs in RankC. In case of ties, buy the ETF with the lowest 21-day historical volatility
- Entry is at the next open.
- Each month sell all ETFs and re-rank.
Results
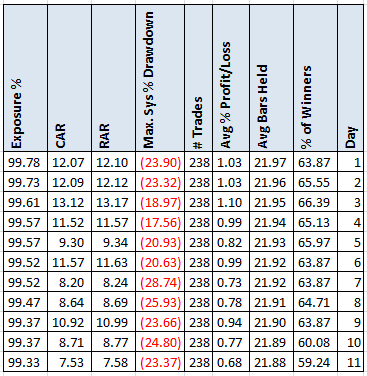
Again the results show a pattern of the trading near the beginning of the month producing better results. Not as strong but still there.
Closing Thoughts
Is it luck that is producing better returns trading at the beginning a month? Not likely. Looking at the yearly returns the same general pattern holds. This does show if you trade a rotational strategy it is important to test all the possible days of rotation to see if there is a pattern or maybe there is a large component of luck
This will be my last post of the year. Next post in mid-January. Have a good and safe Holidays.
Backtesting platform used: AmiBroker. Data provider:Norgate Data (referral link)
Good quant trading

Fill in the form to get the spreadsheet
For a spreadsheet with yearly returns and different number of positions, fill in the form below.


