- in Research by Cesar Alvarez
Equity Curve Correlation Analysis
A reader recently asked how to do equity curve correlation. For detailed information on correlation you can read Correlation and dependence or for simpler explanation read Correlation at Math is Fun. For steps on how to do this in Excel, which is where of course I did it, read Correlation at Excel Easy. I will cover here how one can use correlation analysis between equity curves.
Correlation Coefficient
| Size of Correlation | Interpretation |
| .90 to 1.00 (−.90 to −1.00) | Very high positive (negative) correlation |
| .70 to .90 (−.70 to −.90) | High positive (negative) correlation |
| .50 to .70 (−.50 to −.70) | Moderate positive (negative) correlation |
| .30 to .50 (−.30 to −.50) | Low positive (negative) correlation |
| .00 to .30 (.00 to −.30) | No to negligible correlation |
Adapted from http://www.ncbi.nlm.nih.gov/pmc/articles/PMC3576830/.
When one develops a new strategy, a good question to ask is how does the new strategy perform compared to the market. Meaning if the market goes up will this new strategy likely go up too? And if the market goes down will the strategy go down too? As to what one wants for this value, it all depends on the strategy and your goals. Maybe you want to beat the market over all timeframes. Maybe you want to make money when the market goes down. Then you want a negative correlation. Or you don’t want to gyrate with the market, then you want a value near zero.
Another comparison to do is comparing against existing strategies you are trading or considering. Again there is no good or bad value but understanding how they compare and if you want that.
The Strategies
We will be comparing three equity curves from 1/1/2007 to 9/30/2015.
- SPY buy and hold
- Sigma, a short term SP100 stock strategy I am working on
- Epsilon, a short term ETF strategy I am working on
The Simple Comparison
The simple and most common way to do a correlation analysis to take the monthly returns of two strategies and compute the correlation over the entire period. We will be looking at all three possible combinations.
- The correlation between SPY and Sigma
- The correlation between SPY and Epsilon
- The correlation between Epsilon and Sigma
When you see the correlation coefficient between strategies this is the most likely case. But one can also use weekly returns or daily returns.
Results
| SPY-Sigma | SPY-Epsilon | Epsilon-Sigma | |
| Monthly | 0.50 | 0.02 | 0.06 |
| Weekly | 0.65 | 0.18 | 0.23 |
| Daily | 0.69 | 0.23 | 0.27 |
As expected there is moderate correlation between SPY and Sigma. But notice how the values change as the timeframe changes. For SPY-Epsilon and Epsilon-Sigma there is negligible correlation.
Rolling Lookbacks
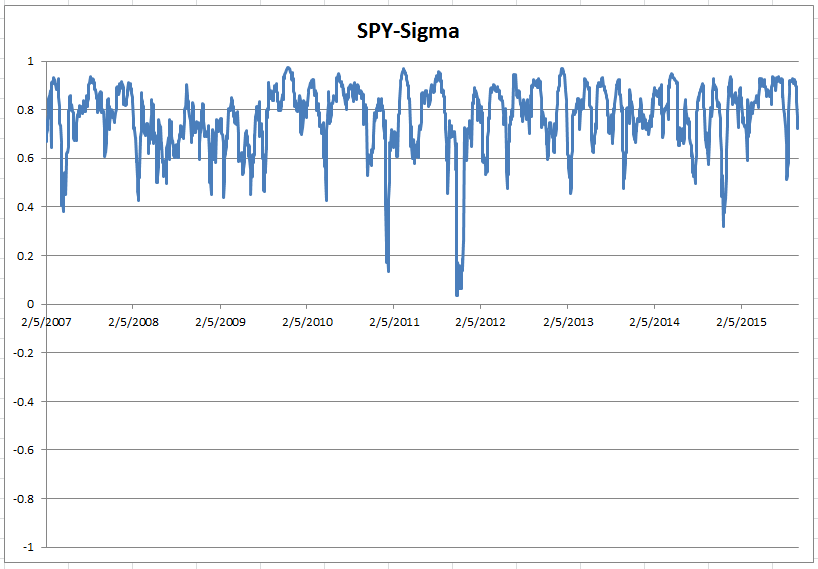
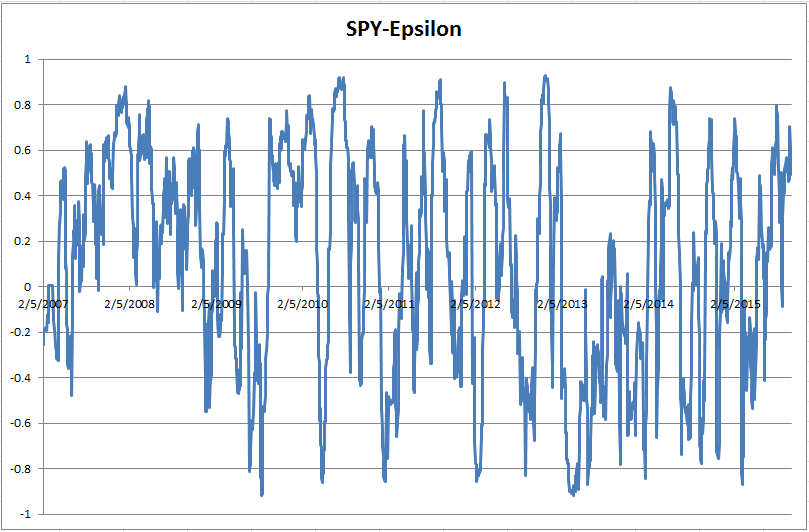
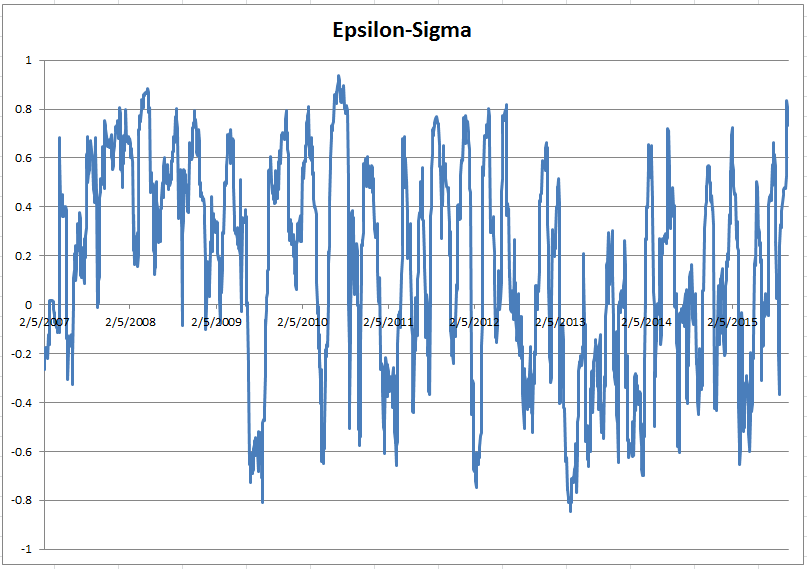
As we have often heard, when the markets crash correlation goes to one. What one cannot see using the analysis above is this true for these strategies? That is why I prefer to do rolling lookbacks. What one does is compute what is the correlation over the last N periods. I typically compute what is the correlation over the last 21 (or 63) days. From this, one can then chart the correlation coeeffient and see when the strategy strongly correlates with the market and when it does not. The charts below use 21 day lookback.
SPY-Sigma
The daily correlation for the entire period is .69 but not we can see how wildly the correlation can vary. One can see the value often approaching 1.
SPY-Epsilon
Now this one is more interesting. The correlation over the entire period is .23. Not very high but now we can see times where it is strongly correlated with the SPY and times where it is strongly inversely correlated.
Epsilon-Sigma
Although the two strategies are weakly correlated over the entire timeframe, we can see again that the correlation can vary a lot.
Spreadsheet
Fill in the form below to get a spreadsheet with the formulas and set up I did to generate the correlations and the charts.
Final Thoughts
As next steps, one can look for specific market events and see how the strategies correlate during those times. Or look when one strategy does poorly and how does the other correlate then. There are lots of ways of doing the correlation analysis. One must understands what information each method gives one.
Have safe and enjoyable holidays. My next post will not be until the middle of January.
Backtesting platform used: AmiBroker. Data provider:Norgate Data (referral link)
Good Quant Trading,

Fill in for free spreadsheet:
![]()


