March 18, 2015

ETF Sector Rotation

My recent research has been in ETFs which I have not explored in several years. ETF sector rotation has always intrigued me. The idea seems so simple that it should work. Always be in the sector that has been doing the best. I like simple but does it work? If not, can we make it work?

ETF Universe

For these test, we will using the Select Sector SPDR ETFs. They have a long history. The list is

  • Consumer Discretionary (XLY)
  • Consumer Staples (XLP)
  • Energy (XLE)
  • Financials (XLF)
  • Health Care (XLV)
  • Industrials (XLI)
  • Materials (XLB)
  • Technology (XLK)
  • Utilities (XLU)

Testing will be from 2005 to 2014.

Baseline

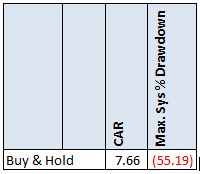
Our baseline will be buy and hold on the SPY. My typical goal when trading ETFs is to beat CAGR of Buy & Hold by 50% but with significantly less drawdowns. Under 25% would be good and under 20% would be great.

150318

Simple Rotation Test

The first test is a simple momentum method.

Rotation Rules

  • At the end of the month, rank the ETFs from high to low of their (6,12) month returns
  • Buy the top (1,2) ETFs on the next open

The six and twelve month values were chosen because those are the ones that are most often referenced in the research I have seen. The spreadsheet contains 3 and 9 month rotation periods.

Results

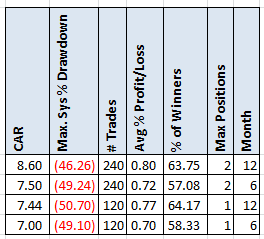
150318a

Not a great start. The results match buy and hold but with a lot more trading. How can we improve on this? Something that I have learned about most rotation strategies is that there are times when even the top ranked ETF is not something that you want to be trading.

Rotation with trend filter and backup ETF

A very popular topic recently is Dual Momentum which has the concept of when an ETF does not pass some filter, instead of investing in that ETF you invest in some alternative ETF. This ETF could be SHY (iShares 1-3 Year Treasury Bond) or TLT (iShares 20+ Year Treasury Bond).

New Rotation Rules

  • At the end of the month, rank the ETFs from high to low of their (6,12) month returns
  • Buy the top (1,2) ETFs on the next open
  • But if the top ranked ETF is below the their (6,12) month moving average, then instead of buying the ETF buy the alternative ETF(SHY,TLT)

In the following example we are using 6 month return and TLT as the alternative ETF. If XLE and XLF are the two top ranked ETFs by 6 month return. Before buying them we check and see if they are trading above their 6 month moving average. Say that XLE is not, then instead of buying XLE we buy the alternative ETF, of TLT.

Results

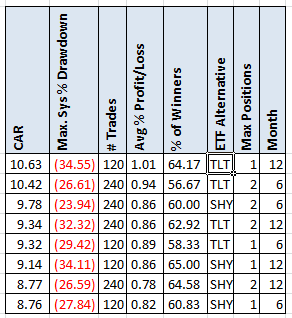
150318b

The results have improved but are still short of my targets.

Rotation with dual ranking, trend filter and backup ETF

Another concept that I have seen with ETF rotation strategies is using more than one ranking. What we do is rank the ETFs by two time periods, add the rankings and then rank again. Taking the top ranked.

New Rotation Rules

  • At the end of the month,
    • Rank1 = rank the ETFs from high to low of their (3,6,9,12) month returns
    • Rank2 = rank the ETFs from high to low of their (3,6,9,12) month returns
    • Rank3 = Rank1 + Rank2
    • Rank rank3. In case of ties, use Rank1 as the tie break.
  • Buy the top (2) ETFs on the next open
  • But if the ETF is below the their (6,12) monthly moving average, then instead of buying the ETF buy the alternative ETF(TLT)

Results

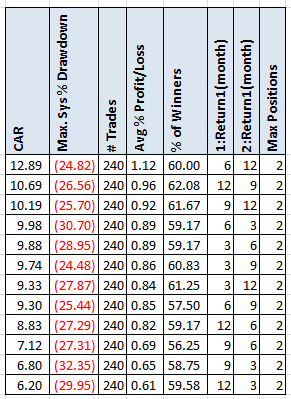
150318c

Now we are getting somewhere. Both CAR and MDD meet my goals but only barely so and only with one variation. Not shown here but you can see in the spreadsheet, is that the top variation made money every year.

Spreadsheet

File the form below to get the spreadsheet with lots of additional information. This includes yearly breakdown, (3,6,9,12) results, and (TLT,SHY) results.

Final Thoughts

I did not quite get the results I wanted but I am getting close. I will have to think about other ideas to try. I would like to find a sector rotation strategy that works. Got any ideas on what to try? Send them my way.

Backtesting platform used: AmiBroker. Data provider:Norgate Data (referral link)

Edit 1/25/2017: See this post on Country ETF Rotation based on the same concepts.

Good quant trading,


I am now off to enjoy my birthday. Good lunch followed by a long massage. Then getting beat up by my BJJ friends in class tonight. What a good day!

 Fill in for free spreadsheet:

spreadsheeticon


Visited 44 times, 1 visit(s) today

Click Here to Leave a Comment Below

Aaron - March 18, 2015 Reply

Try combining the 3,6,9,12 month lookbacks into an average of the 4 lookback periods. Also, try using IEF instead of TLT. TLT is pretty volatile and IEF is much smoother.

And also try holding more than 1 or 2 of the top ETFs. Try 3-5 ETFs at a time.

Cesar Alvarez - March 18, 2015 Reply

In the spreadsheet, I show the results of holding the top 3. I decided not to do more because than I am holding more than 1/3 of the index.

Mike - March 18, 2015 Reply

Try subtracting the most recent month’s price action (6 months return – 1 month return or 12 – 1). This reduces the risk of buying a blow off top and is a popular momentum calculation in academic papers.

    Cesar Alvarez - March 18, 2015 Reply

    I have tried that idea before but it never really seamed to do much in the way of hurting or helping the returns

Ilya Kipnis - March 18, 2015 Reply

Happy birthday, Cesar!

Yeah, I definitely do have some ideas, which I already blogged about.

Here you go:

https://quantstrattrader.wordpress.com/2015/01/30/comparing-flexible-and-elastic-asset-allocation/

There’s also the stuff Logical Invest does, which I have yet to sink my teeth into.

-Ilya

TrendXplorer - March 18, 2015 Reply

Hi Cesar,

Thanks for sharing and have a wonderful day.

As a birthday present I am going to send you the EAA-model I coded for AmiBroker 🙂
It is the same strategy Ilya is referring to. The model is explained on my blog with a link to the SSRN source.

Enjoy you birthday, mine almost over 😉
JW

Thomas Musselman - March 18, 2015 Reply

In my tests using Fidelity Select Funds since their start in the 1980s using best 10 month momentum top 1,2,3 funds all worked with monthly tradeing. Don’t know if you can test that or not.. Nice since if you hold for 30 + 1 day no transaction costs at Fidelity.

    Cesar Alvarez - March 18, 2015 Reply

    Can you tell me which one you use? I would like to test them and see what kind of results I get.

    Thanks,
    Cesar

Ola - March 18, 2015 Reply

Hi Cesar,

Some ideas:
1. Try adding inverse ETFs into the mix.
2. Try weighting ranks instead of just adding them.
3. Try changing the day of the month the rotation takes place.
Always enjoying your posts. Keep them coming!

Cheers,
Ola

    Cesar Alvarez - March 19, 2015 Reply

    Good ideas here. It is looking like there is enough interest in this topic that I will do another post.

Thomas Musselman - March 18, 2015 Reply

19890103 starts 31 sector funds
19810714 only has 3 funds

fbiox,fshox,fbmpx,fschx,fsrpx,fdlsx,fscpx,fsphx,fphax,fsaix,fscgx,fcyix,fsrfx,fsdax,FBSOX,FDFAX,FIUIX,FSCSX,FSDPX,FSVLX,FSHCX,FSPCX,FSAVX,FDCPX,FSTCX,FSUTX,FSPTX,FWLRX,FSRBX,FSENX,FNARX,FSFSX,FSELX,FIDSX,FFGCX,FSNGX,FSAGX,FSLEX,FSLBX,FSDCX,FSVLX,FSESX,fsdpx

On July 11, 1999, Jay Kaeppel published an article in “Technical Analysis of Stocks and Commodities” magazine and in 2001 another but stripped down version titled “Trade Sector Funds with Pure Momentum” which detailed one trading method using Fidelity Select Sector funds:

-After the close of the last trading day of the month identify the five Fidelity Select Sector funds that have the largest gain over the previous 240 trading days.

-ignore Select Gold (ticker FSAGX): if it appears in the top 5 funds skip it and include the 6th highest rated funds.

-If fewer than five funds showed a GAIN over the previous 240 trading days, then hold cash in that portion of the portfolio.

The web identifies him referring to the earlier 1999 article. It looks like its rules were simply:
at month end identify the 5 sector funds up most in 240 trading days, and buy and holdat least until next month end; then repeat.

I tested simply hold 22 market days, rebalance montly or every 2 months, all available at any moment (price>$1), i.e. not excluding gold.
Given the age of Jay’s article there is now a long out-of-sample period.

Thomas Musselman - March 18, 2015 Reply

fbiox,fshox,fbmpx,fschx,fsrpx,fdlsx,fscpx,fsphx,fphax,fsaix,fscgx
,fcyix,fsrfx,fsdax,FBSOX,FDFAX,FIUIX,FSCSX,FSDPX,FSVLX,
FSHCX,FSPCX,FSAVX,FDCPX,FSTCX,FSUTX,FSPTX,FWLRX,
FSRBX,FSENX,FNARX,FSFSX,FSELX,FIDSX,FFGCX,FSNGX,
FSAGX,FSLEX,FSLBX,FSDCX,FSVLX,FSESX,fsdpx

in case the way it appears in earlier comment means whole list isn’t
visible

    Cesar Alvarez - March 19, 2015 Reply

    Thanks for the list and the rules. The list is much bigger than I expected. It should be interesting to see what my testing shows.

The Whole Street’s Daily Wrap for 3/18/2015 | The Whole Street - March 18, 2015 Reply

[…] ETF Sector Rotation [Alvarez Quant Trading] My recent research has been in ETFs which I have not explored in several years. ETF sector rotation has always intrigued me. The idea seems so simple that it should work. Always be in the sector that has been d… […]

panskeptic - March 19, 2015 Reply

Apparently sector rotation has never been as successful as asset class rotation. You may be pushing on a string here.

A lot of different systems have been tested over at CXO Advisory.

http://www.cxoadvisory.com/?s=sector

    Cesar Alvarez - March 19, 2015 Reply

    Thomas above says it works with Fidelity funds. Even if a strategy has failed to produce good results I still like looking at it. I always optimistic that I might stumble on the right twist to make it work.

Thomas Musselman - March 19, 2015 Reply

Keep in mind that Fidelity has not 1 fund for “technology” but many subdivisions so maybe that helps performance compared to test on ETFs that view technology as 1 sector.
I found 200 day for look-back good, and 2 month holds lost 1/2 % in cagr vs. 1 month holds.
For most of last year and the year before it had me in biotech, which helped. It seems to beat SPY most years and the good years more than make up for the bad.

Chris T - March 19, 2015 Reply

First off, trading asset classes instead of sectors tends to be more profitable. tlt. spy efa, vwo gld etc…

I have a system that rebalances monthly using a moving average and a look back period. Here are the results as of today :

2007-2014 : CAGR +430 %

volatility 17.4%

Drawdow -16%

You likely wont find a system with these numbers and I have evidence to support them. The point is,
asset class trading tends to be more profitable than sector rotation. It all starts with your objectives…

    Cesar Alvarez - March 20, 2015 Reply

    Chris,

    I agree that trading asset classes seems to work better. I will be doing a post on that later. I personally have an ETF strategy that trades asset classes. I assume you have a typo in the CAGR. Making 430% a year would be insane and I would just give you my money to manage. : )

    Cesar

todd - March 19, 2015 Reply

Try this. It is not Sector rotation but industry rotation.

1. buy top ranked industry according to past 6 months performance.

2. only buy the top ranked industry. (only top 1)

3. Hold ETF until it’s rank drops below 14

The initial test of this was not done using ETF”s. It ranked all stocks in each industry from close of today to close of 6 months ago. This is how the top indusry was found.. You had to buy all stocks in the industry. If you buy all of the stocks in the industry ranked 1 for performance and hold them until the rank fell below 14 (and sell them), you would have made an average of 28.1% from 1/1/1995 to 11/9/2007. The S&P 500 index, over the same hold time, gained an average of just 2.3%. There were 114 trades made during that period.

With all the specific ETF’s available, you do not have to buy individual stocks, but industry specific ETF”s. For example, if biotech is top rated industry just find the ETF that is heavily concentrated in biotech stocks. When biotech was rated #1, I bought XBI. I am still in XBI because it has not dropped out top 14 ranking. Biotech is currently ranked #4 as of last Friday. This has been really good to me. However with biotech comes viotility and in near future I can see the industry take a fast fall. May want to use discretion in this industry and may not wait until it drops below #14.

The initial test also showed that buying the top 2 or 3 industries reduced returns. Buying only the top 1.

I would love to see this backtested from 2008-2014 for the results.

Thoughts:

1. When ranking the industries try 3,6 9. and 12 month strength and average them, but put double weight on the 3 month.

2. I am not sure if all industries have specific ETF’s. There are 54 industries that I follow each week. One option would be for industries with no specific ETF, would be motifinvesting.com where you can buy up to 30 stocks in one basket for $9.95 commission for ALL the stocks in your basket. (the whole basket) You can sell individual stocks in your basket for like $4.95. See the site for details. Pretty cool. If there is no specific ETF for top ranked industry, you could perhaps buy a basket of the best 5,6,7 or however many stocks in that industry.

3. As of Friday March 13, the top 6 industries are:

1. Retail Building Supply ( Lowes, Home Depot, etc.)
2. Human Resources:
3. Drug: (This would relate to a pharma ETF like XBH)
4. Biotech
5. Furnishings/Home furnishings
6. Air Transportation

I think this may work pretty well for a few reasons:

1.Momentum has been proven to work.

2. Buying top ranked stocks in top ranked industry has proven to work

3. Buying top ranked each month causes more trading and there is too much whipsawing. Top ranked today might be #1 but #6 next month and then back to #2 the following month.

4. By drilling down into the sector and finding the best industry, you are not over diversifying.

    Cesar Alvarez - March 20, 2015 Reply

    This is an interesting idea. There are a couple issues I see for myself. First I do not have historical industry data. As you point out there are not ETFs for all the industries and my bet is that the volume on some of them would be very low. I don’t think I could concentrate myself completely in one industry. It would be hard for me to trade that.

    Thanks for the idea though,
    Cesar

Oliver - March 21, 2015 Reply

I was thinking about the drawdowns rather than CAGR – maybe you could add an efficiency ranking using return/volatility for the time periods instead of raw return. I don’t think it would improve the CAGR but I think it would reduce drawdowns. You could even combine that with an options or other leverage strategy in implementing to get the CAGR/DD balance where you like.

todd - March 21, 2015 Reply

here is one I just found that may work. It is from a forum.

Going into Jan the top relative strength ETFs I trade in my son’s 401K were TLT VNQ RTH amd XLU. We do not track IBB but use the spider sectors and TLT VNQ QQQ and RTH. XLV includes many of the bio tech large caps. As I have mentioned we stay in the top 4 sectors and rebalance at the end of the month if the top 4 drop out ot the top 6 and go to cash when there are no sectors closing above the 10 month MA on the monthly chart at months end. Simple but very effective method. The interest sensitive relative strength sectors did a years work in Jan. with TLT up 9.82% VNQ up 6.85% XLU up 2.84% and RTH up 0.56% for a total gain of 4.89% versus the S&P being down 2.96%. For those working folks this is a wonderful way to run your retirement money. Relative strength works very well thank you.

All decisions are made at months end. That way you do not get shook out of positions like you would have been last Oct during the sharp drop early in the month followed by a booming v sharped rally the 2nd half of the month. You can use the IBD RS ratings. I use a 6week 12 week 18 week and 24 week rate of change and double weight the 6 week and then divide those 4 values by 4 for a cumulative number and compare that with the same SPY value and stay with the top 4 as long as they are stronger than the market as represented by the SPY value. On renko charts you can use point values like you would with P&F charts and I have seen them where the user calculates his own point values based upon some kind of volitility formular with which I am unfamilar. The problem with renko is its late and you will many times payup once you get a signal on close. Take a look at weekly charts using Elder Impulse with a 10 week MA and buying the first green week up after a series of blue and red correction countertrend corrections. They might give earlier signals than renko. I have only recently been studying this and have not back tested it but it looks promising.

relative strength can be measure by a percentage gain over various periods of time and then you compare that to how other instruments have done during the same period. Like ROC.

Axel - May 15, 2015 Reply

Hi Cezar ! i enjoyed reading your post. this is what i do:

(1) rank the 9 SPDR sector ETFby the average of the 3/6/12 months performance (= relative momentum)
(2) buy the top 3 ETF if condition (3) is met (otherwise move to cash) (= absolute momentum)

(3) only be invested in an ETF if the average of the 3/6/12 months performance is greater than the average of the 3/6/12 months performance of SHY (this is a lot smoother than moving averages in my experience, i.e. less whipsaws)

(http://www.etfscreen.com/cchart.php?wl=51224&s=RSf%7Cdesc&t=6&d=i&udc=default&vFf=dolVol21&vFl=gt&vFv=0&ftS=yes&ftL=yes)

(4) since i use the ETF sector rotation as a savings plan, i invest a defined amount of money each quarter. therefore i use an additional simple timing model:

(A) buy the top 3 ETF during weakness, therefore i use the RSI(2) weekly < 10
(B) if condition (A) was not met during the last quarter, then buy the top ranked ETF at the end of the quarter

what do you think about this strategy ?

Cesar Alvarez - May 18, 2015 Reply

@Axel. I like your idea in steps 1 to 3. I am not sure how I would test your method of adding money. It does make sense though.

Cesar

| Alvarez Quant Trading - May 27, 2015 Reply

[…] post ETF Sector Rotation generated some good ideas on what to try differently. This post will focus on two ideas on the […]

mikel - May 28, 2015 Reply

Cesar have you looked into the “Sector Surfer” software? It does sector rotations but uses signal to noise techniques to pick up changes and trends rather than momentum and moving average rules (so I’m told). I know some smart engineers who know swear buy it and they’ve done all types of trading and model building over the years.

http://www.sumgrowth.com/

    Cesar Alvarez - May 28, 2015 Reply

    I have not seen it before. Unfortunately it looks like these are proprietary algorithms so I cannot test them.

    Cesar

Mutual Fund Sector Rotation – Ideas from readers | Alvarez Quant Trading - June 24, 2015 Reply

[…] post ETF Sector Rotation generated good ideas on what to try differently. This post will research two ideas using Fidelity […]

ramin - July 8, 2015 Reply

Hey
have you tried to create long-short portfolios as well ?
cheers
R

    Cesar Alvarez - July 8, 2015 Reply

    I have not tried a long short portfolio.

Davide Chirico - May 16, 2016 Reply

Hi Cesar,
good post,
i try to test your rank rotational strategy adding 2 more filters:
1) Autocorreltion
2) HV100 days
Maybe we can better devide market in different regime and find when to go cash or maybe use different type of strategies like mean-reversion insted of Momentum strategy.
David

    Cesar Alvarez - May 16, 2016 Reply

    Good ideas. I am a big fan of different market regimes.

Ron - January 25, 2017 Reply

In the last results table we have:
• 1st ranked system is 12 then 6 month with max 2 pos with CAR of 12.89 and MDD 25%
• 9th ranked system is 6 then 12 month with max 2 pos with CAR of 8.83 and MDD 27%

Why the significant difference between the two when Rank3 would be teh same for both?

john - June 6, 2017 Reply

I use the 200 day moving average with the 9 sector ETF’s (10% of my portfolio per sector). Actually, i use a 40 week MA which has less whipsawing and is close to 200 days. When a sector goes above the MA, I buy 10% in that sector and when it hits the MA, I sell and buy IEF (7-10 yr Treasuries). So currently, i am 80% invested (all sectors except energy) and 20% in Treasuries. If one sector hits the MA, then I will sell and I will then be 30% in treasuries. Have back-tested and it done well through the financial crisis as it was out of most sectors in mid-late 2007 except for the defensive so I was mostly in treasuries in 2008. Reply if you have any comments, i would like to hear your thoughts.

    Cesar Alvarez - June 6, 2017 Reply

    I have not tested this. I like it because it is simple. Which 9 ETFs are you trading? I would like to test this and write about it.

Mark - October 24, 2017 Reply

Are you data mining? When you start off with one [set of] rule and then try adding another or another to see if you get better performance, I feel something is wrong with that approach because if it is data mining (or curve-fitting) then there’s a decreased chance what happened in the past will persist into the future.

One possible solution would be to develop on IS data and then test on OOS data. Walk-forward validation is another possibility. I don’t see you doing either of these and I’m guessing you have your reasons. Why?

Thanks!

    Cesar Alvarez - October 24, 2017 Reply

    One is data-mining from the very start. If you can come up with the final rules in one go, you are a much better strategy developer than I am. Even if I know all the rules I want in a strategy, I still like to test them one at a time to make sure that they are useful. Or i will test with all of them and then remove them one at a time to see what changes. It really does not matter if you only try one idea or 1 million. That tells you very little about how likely it is to work in the future. The tests I do after finding a strategy I like our parameter sensitivity and my version of out of sample (I have written about both of these). But even these don’t guarantee anything. As to walk forward testing, I am not a fan of that.

Frank - November 14, 2017 Reply

The best CAGR sector rotation system I have found is quartile sector rotation, but the drawdowns are large.

https://soundmindinvesting.com/articles/view/sector-rotation-is-risky-but-highly-rewarding1

I would start with this and then look at strategies to reduce its drawdown(if possible)

    Cesar Alvarez - November 14, 2017 Reply

    I have tested similar rules in the past. I will add this to my long research list. Thank you for sharing

Jack Loftis - October 3, 2018 Reply

Hey, Caesar.
Years ago Pankin had great sector rotation results using a 3-week look back period to identify the top performer — and on the average the sector was held a couple of months. Worked well.
I’ll see if I can find his whole rule set and shoot it to you.

Thanks for the work,
jack

    Cesar Alvarez - October 3, 2018 Reply

    If you find it please do share. If it looks like it has promise I would love to test and blog about the results.

Donald Byrge - October 4, 2018 Reply

For some great ideas, take a look at Jay Kaeppel’s Pure Momentum system at his website (see link below) or his 2001 article in “Technical Analysis of Stocks and Commodities” magazine. It’s a really simple system that has stood the test of time, and the rules are clear and easily testable.

http://jayonthemarkets.com/?s=Pure+Momentum

Several years ago, I developed a modified version of Kaeppel’s system using weekly data and three ranking periods. For the period 9/1/1988 to 9/28/2018, the system produced a CAGR of 19.96% and incurred a max drawdown of 36.33%. The system drawdown, admittedly, is large, but it is much less than the drawdown of 55.19% incurred from buying and holding the SPDR S&P 500 ETF.

Check it out. See if you like any of these ideas.

Thanks for sharing your research!

    Cesar Alvarez - October 5, 2018 Reply

    Thanks. It seems to be a simple 240day ROC on Fidelity mutual funds. I tested something very close to that in this post

Leave a Reply: