- in ETFs , Research by Cesar Alvarez
How good is Smart Beta?
A popular topic lately has been “Smart beta” ETFs. What is smart beta? It is using different ways to weight an index and the ETF that tracks it. For example, the S&P500 index is a capitalization weighted index. Bigger companies have a larger portion of the index. If you look at the SPY, Apple which is the largest company, accounts for 4% of the index (https://www.spdrs.com/product/fund.seam?ticker=spy). Other ways one can weight an index are equal weight, by volatility, by fundamental measures, by technical measures and so on. Why would you do this? To beat the returns of the S&P500 index . But are these other ways better?
Testing Notes
Test dates from 1/1/2005 to 3/31/2015. No commissions. Buy and sell on the last trading day of the month at the closing price. Rebalance all positions on this day too. All returns include dividends.
Baseline tests
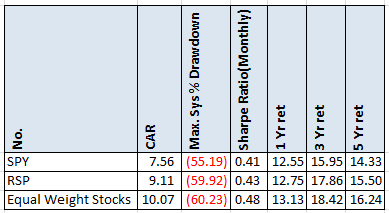
Here we have the returns for the SPY. The Guggenheim S&P 500 Equal Weight ETF, RSP, all stocks are approximately .2% in size. Then equal weight stocks using data from Norgate Data which has historical index constituent information. All the S&P500 stocks as equal weight with a rebalance each month. The results are close to RSP and with the yearly numbers, which you can see in the spreadsheet.
The weightings
We will examine several technical indicators and use those for weightings. We can either favor lower or higher values. How is weighting done? An example of higher value weighting is as follows. There are three stocks in the index with technical values of 20, 30 and 40. First sum all the values to get 90. Then for stock 1 the weighting would be 20/90 or 22.2%. For stock 2 it would be 30/90 or 33.3%. For stock 3, the weighting would be 40/90 or 44.4%.
If we wanted to favor lower values, then the weightings are determined as follows. Take the reciprocal values of all the indicators and add them up. For this example we have 1/20, 1/30 and 1/40. The sum being .108333. The weighting for stock 1 is (1/20)/.108333 or 46.3%. The weighting for stock 2 is (1/30)/.108333 or 30.8%. The weighting for stock 3 is (1/40)/.108333 or 23.1%.
The indicators being tested are
- 100 day historical volatility
- 2 period daily RSI
- 10 period daily ADX
- 21 day total return
- 21 day moving average of Close*Volume
The last one, I added after I had done all the others and was surprised that they did not produce better CAR than I expected..
The results
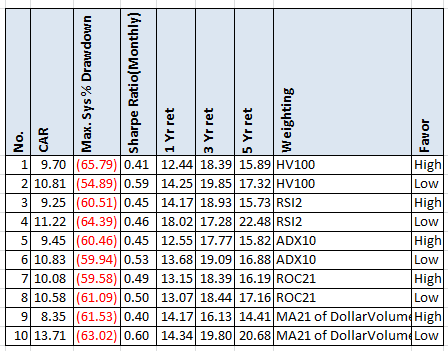
First notice there is no improvement in MDD. So much for smart beta helping there. Given that the baseline return is 10.07 CAR for equal weighting, these indicators are working by giving a little extra beta. I was expecting HV100 to produce better results on both low and high from my own research. Surprisingly a short term indicator, RSI2, produced good results 1 month out. Another disappointment was ROC21. The results are opposite from all the momentum expectations. The big surprise is the DollarVolume. Going for those low really values out produced all other indicators. If you start an ETF using this, don’t forget to send me licensing checks. Granted the ETF could not handle much money because your biggest positions would be in the least liquid stocks.
Monte Carlo
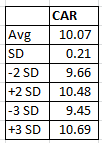
What if we randomly assigned every sock a value between 1 and 100 and use that for sizing? What would the average and standard deviation of the CAR be? This would help give context to the above results.
After a thousand runs, as expected the average CAR of 10.07 matches equal sizing. I did not expect how small the standard deviation would be. Most of the indicator results produce values over three standard deviations.
A smaller portfolio
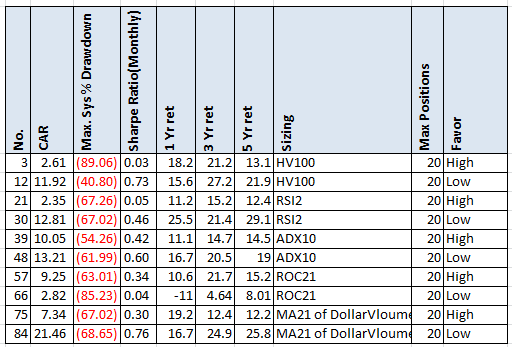
This is all interesting but we can’t trade 500 stocks, ignoring no one wants to trade a strategy with a 60% MDD. What does a portfolio of smaller positions look like? The stocks will still be proportionally weighed according to their indicator values.
The indicators HV100, RSI2 and DollarVolume worked as expected. The returns for low increased while the returns for high decreased. ROC21 numbers are all screwy from what one would expect. DollarVolume again producing some impressive CAR numbers, if we could only ignore that drawdown. There may be a start of a strategy here.
Links for more information on Smart Beta
- http://www.researchaffiliates.com/Our%20Ideas/Insights/Smart%20Beta/Pages/Home.aspx
- http://www.cnbc.com/id/102500144
- http://www.forbes.com/sites/billstone/2014/09/03/how-smart-is-smart-beta/
- http://seekingalpha.com/article/3118616-how-smart-are-smart-beta-etfs
The spreadsheet
The spreadsheet includes yearly breakdown of returns, other portfolio sizes and the Monte Carlo runs. Fill in the form to get it.
Final thoughts
Remember, the original S&P500 index is capitalization weighted. Imagine instead of being capitalization weighted the index was equal weight and those results were worse than capitalization weighted. We would then call ‘capitalization weighting’ smart beta because it beats the index. There is nothing special with any weighting scheme other than being different. One can make arguments about why one is better than the other but it is arbitrary. And here is the rub with smart beta. If it is still in all the S&P500 stocks, it is hard to avoid that massive drawdown. I don’t care how much more beta one gets, with drawdowns like that it is very hard to justify doing it.
I am off next week to Australia to present at the 2015 Australian Technical Analysts Association. It should be lots of fun.
Backtesting platform used: AmiBroker. Data provider:Norgate Data (referral link)
Good Quant Trading,

Fill in for free spreadsheet:
![]()


