- in Mean Reversion , Research , Stocks by Cesar Alvarez
How much does not having survivorship free data change test results?
Over the last month several people have asked me how important it is to have survivorship-free data. For any researcher this is an important question to understand how the different data can change your results. We will be exploring three potential data issues: as traded prices, delisted stocks (survivorship-bias), and historical index constituents (pre-inclusion bias).
My data source is CSI Data, which includes delisted stocks and as traded prices. Unfortunately they are no longer selling this package to individuals. Norgate Data supplies delisted stocks and as-traded pricing. I have not used them before. I welcome comments from people that have on the quality of their data and customer service.
General Information
For the system used for ‘As Traded’ and ‘Delisted’ tests, entry and exit is on the open, maximum of 10 positions and signals are rank from high to low by 100 day historical volatility. Test results are from 1/1/2004 to 12/31/2013.
As Traded Prices
Setup
- The 21 day Moving Average of Close*Volume is greater than $(5,15) Million
- RSI(2) is less than 5
- Close down three or more days in a row
- 100 day Historical Volatility is greater than 40
- Close greater than 200 day Moving Average(tested with and without this rule)
- (As-trade price, adjusted-price) greater than $5
- Using delisted stocks
- Previous day is a setup, place a limit order 5% below previous day’s close
- Close greater than 5 day Moving Average
Buy
- Previous day is a setup, place a limit order 5% below previous day’s close
Sell
- Close greater than 5 day Moving Average
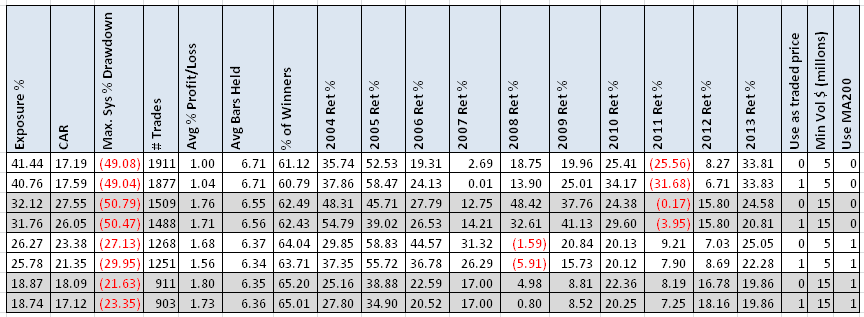
As traded price is the actual price a stock traded on a particular day before splits, dividends, and one-time dividends. For example, you may have a rule that you do not trade stocks under $10. If you ran a test back to 1996, after splits and dividend adjustment MSFT price is around $7. MSFT was actually trading at around $150.One would skip this stock if they did not have as-traded pricing.
(Click on image for larger version)
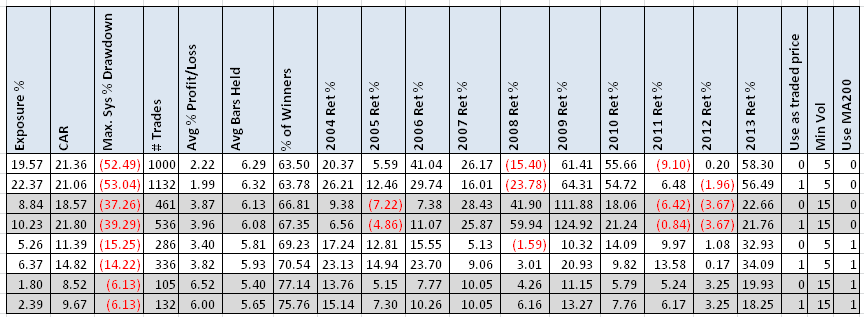
I had never run this test before and these results surprised me. Overall there is no significant difference in using as-traded price vs. adjusted price. The following tests using prices between $1 and $5.
(Click on image for larger version)
Again there is no significant difference in using as-traded price vs. adjusted price.
Delisted Stocks (Survivorship Bias)
Setup
- The 21 day Moving Average of Close*Volume is greater than $(5,15) Million
- RSI(2) is less than 5
- Close down three or more days in a row
- 100 day Historical Volatility is greater than 40
- Close greater than 200 day Moving Average(tested with and without this rule)
- As-trade price greater than $5
- With and without delisted stocks
- Previous day is a setup, place an limit order 5% below previous day’s close
- Close greater than 5 day Moving Average
Buy
- Previous day is a setup, place an limit order 5% below previous day’s close
Sell
- Close greater than 5 day Moving Average
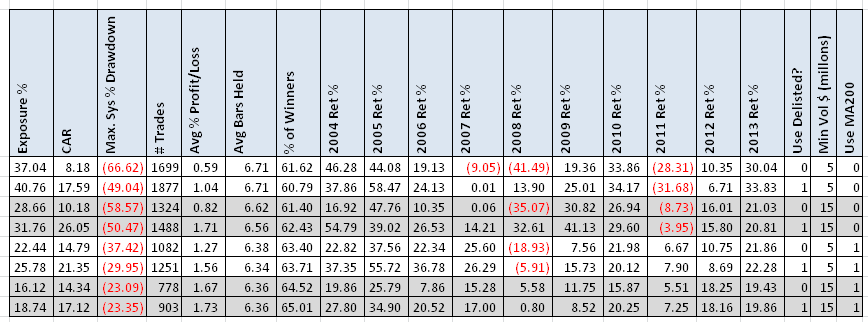
(Click on image for larger version)
I did this test about 8 years ago with similar results. For this mean reversion system, adding the delisted stocks improves the results. The improvement without the 200 day moving rule is huge. Now can we generalize that all mean reversion systems will get better with delisted stocks, no.
Trend Following System
(Click on image for larger version)
For this trend-following system (I cannot share the rules), the results got worse. CAR went down, MDD goes up and Avg %p/l drops dramatically. Not using survivorship free data would hurt you in this case.
Historical Index Constituents (Pre-inclusion Bias)
Pre-inclusion bias is using today’s index constituents as your trading universe and assuming these stocks were always in the index during your testing period. For example if one were testing back to 2004, GOOG did not enter the S&P500 index until early 2006 at a price of $390. But your testing could potentially trade GOOG during the huge rise from $100 to $300.
Rules
- It is the first trading day of the month
- Stock is member of the S&P500 (on trading date vs as of today)
- S&P500 closes above its 200 day moving average (with and without this rule)
- Rank stocks by their six month returns
- Buy the 10 best performing stocks at the close
(Click on image for larger version)
People often write about systems they have developed using the current Nasdaq 100 or S&P500 stocks and have tested back for 5 to 10 years. Looking at this table shows that one should completely ignore those results. The difference between the two results is scary. Using the current list would make one think that they had a great system but actuality it was much worse.
Final Thoughts
Good data is important. We have lots of landmines to avoid when testing but avoiding survivorship bias and pre-inclusion bias is easy to do. If you test on a stock universe, buy the delisted stock data.
Spreadsheet
If you’re interested in a spreadsheet of my testing results, enter your information below, and I will send you a link to the spreadsheet. The spreadsheet contains more variations I tested along with yearly returns. Any suggestions what additional items you would like to see in these spreadsheets?
Backtesting platform used: AmiBroker. Data provider:Norgate Data (referral link)


